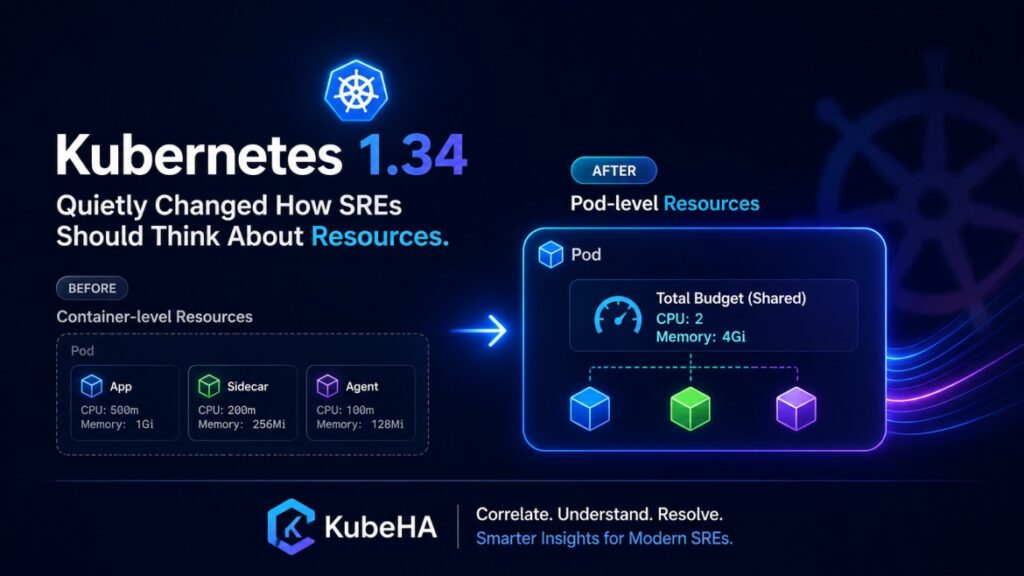
Kubernetes 1.34 Quietly Changed How SREs Should Think About Resources.
Most engineers upgraded Kubernetes 1.34 and focused on release highlights.
Few noticed a change that may significantly alter resource planning, autoscaling behavior, and workload optimization:
Kubernetes now supports Pod-level resource requests and limits (Beta), and HPA can use them.
This sounds minor.
It isn’t.
Why Resource Management in Kubernetes Was Always Awkward
Until now, resource requests were mostly defined per container:
containers:
- name: app
  resources:
    requests:
      cpu: 1
      memory: 2Gi

- name: sidecar
  resources:
    requests:
      cpu: 200m
      memory: 256Mi
For multi-container Pods (service mesh sidecars, log agents, OTEL collectors, proxies):
Teams often had to:
• overprovision resources
• manually split budgets
• tune sidecars independently
• accept inefficient scheduling
This frequently led to:
- wasted node capacity
- inaccurate autoscaling
- noisy resource alerts
- poor workload packing
What Kubernetes 1.34 Introduced
You can now define resource budgets at the Pod level, not only per container:
spec:
  resources:
    requests:
      cpu: 2
      memory: 4Gi
Containers within the Pod can share from this overall budget. Pod-level requests take precedence when defined.
This changes assumptions around:
🔹 Scheduling behavior
Scheduler decisions become influenced by aggregate Pod budgets rather than only container allocations.
🔹 HPA calculations
HPA now supports Pod-level resource specifications.
🔹 QoS classification
QoS behavior is influenced by Pod-level definitions.
🔹 Sidecar-heavy workloads
Resource sharing becomes easier for:
- service meshes
- OpenTelemetry collectors
- log shippers
- security agents
Why SREs Should Care
This may improve efficiency.
It may also create new failure patterns.
Imagine:
Shared Pod budget → sidecar spikes → application starves
or:
HPA scales based on aggregate behavior → masking bottlenecks
or:
Pod appears healthy → internal containers compete for shared resources
The debugging model changes.
Autoscaling Interpretation May Become Harder
Traditional assumption:
High CPU → Scale replicas New reality:
Shared Pod budget → Resource contention → HPA decision Was scaling caused by:
- application load?
- sidecar growth?
- telemetry overhead?
- mesh proxy behavior?
Understanding why scaling happened becomes harder.
Resource Optimization Gets More Complex
Previously:
Tune container A → observe impact
Now:
Tune Pod → multiple containers inherit behavior
This improves flexibility.
But increases correlation challenges.
What Mature SRE Teams Will Need
Kubernetes 1.34 pushes teams toward:
✅ workload-level resource analysis
✅ dependency-aware scaling investigation
✅ sidecar impact monitoring
✅ change-to-impact correlation
✅ Pod budget efficiency tracking
Monitoring CPU graphs alone won’t be enough.
How KubeHA Helps
As Kubernetes moves toward shared Pod resource models, understanding impact becomes harder.
KubeHA helps correlate:
• Pod-level resource changes
• HPA scaling events
• deployment updates
• sidecar behavior
• restart patterns
• metrics anomalies
• dependency latency
Instead of seeing:
“Pods scaled from 5 → 12”
KubeHA surfaces:
“Scaling began after telemetry sidecar memory growth increased Pod-level resource consumption following deployment v4.1.”
This shifts investigation from:
❌ What changed?
to:
✅ Why did the system behave this way?
Real Question Kubernetes 1.34 Introduces
The challenge is no longer:
“How much resource does my container need?”
The challenge becomes:
“How should multiple containers share resources without creating hidden instability?”
That is a very different SRE problem.
Final Thought
Kubernetes 1.34 quietly changed resource management from:
Container-centric → Pod-centric
That may improve efficiency.
It may also introduce entirely new debugging patterns.
Teams that understand these shifts early will optimize faster and troubleshoot better.
👉 To learn more about Kubernetes resource behavior, autoscaling changes, and production observability patterns, follow KubeHA (https://linkedin.com/showcase/kubeha-ara/).
Book a demo today at https://kubeha.com/schedule-a-meet/
Experience KubeHA today: www.KubeHA.com
KubeHA’s introduction, https://www.youtube.com/watch?v=PyzTQPLGaD0
#DevOps #sre #monitoring #observability #remediation #Automation #kubeha #IncidentResponse #AlertRecovery #prometheus #opentelemetry #grafana, #loki #tempo #trivy #slack #Efficiency #ITOps #SaaS #ContinuousImprovement #Kubernetes #TechInnovation #StreamlineOperations #ReducedDowntime #Reliability #ScriptingFreedom #MultiPlatform #SystemAvailability #srexperts23 #sredevops #DevOpsAutomation #EfficientOps #OptimizePerformance #Logs #Metrics #Traces #ZeroCode