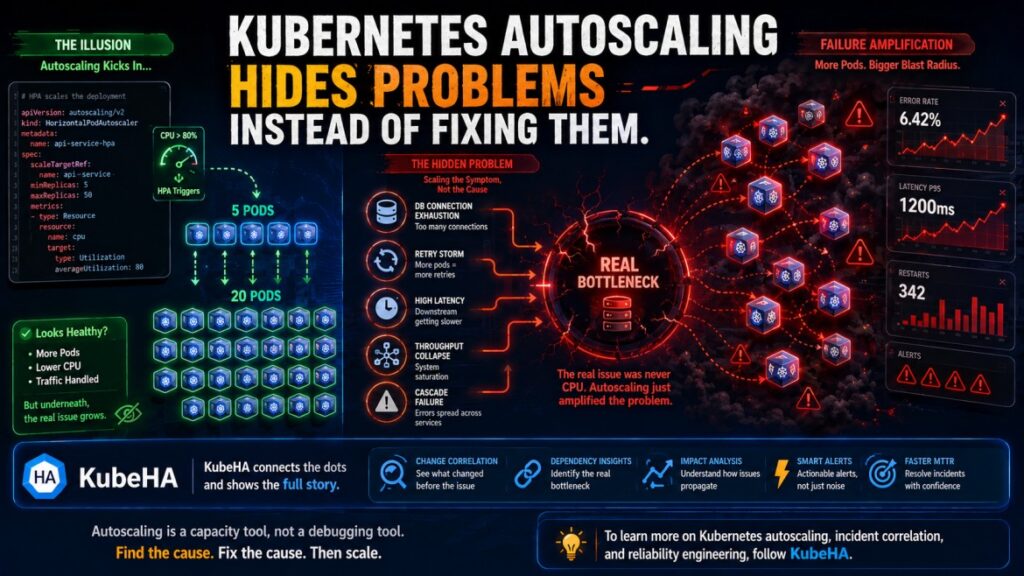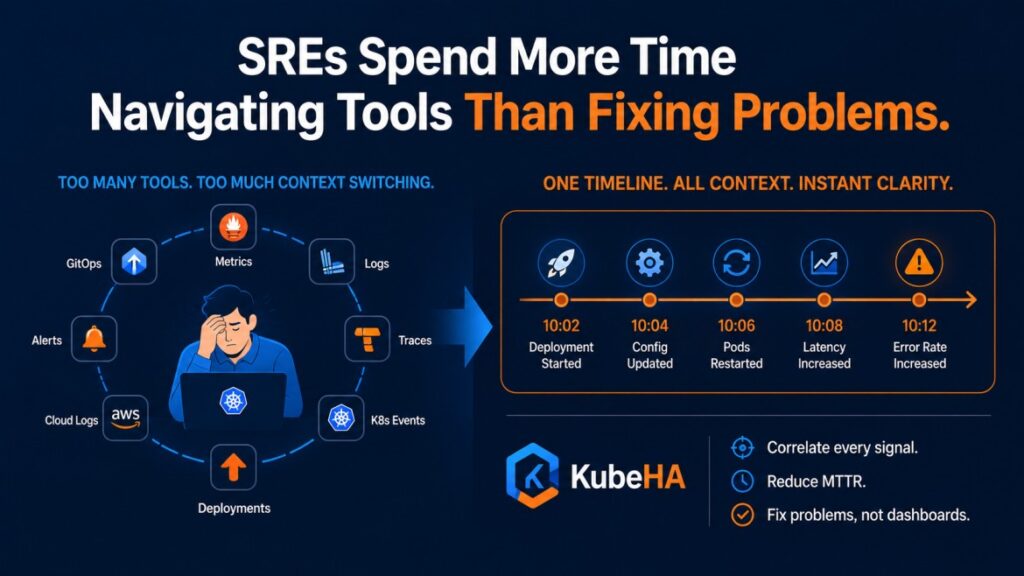
SREs Spend More Time Navigating Tools Than Fixing Problems.
Modern observability promised to make operations easier. Instead, many SREs now spend their incident response time navigating between tools. A typical production incident looks like this: Alert Fired ↓ Open Grafana ↓ Open Prometheus ↓ Open Loki ↓ Open Tempo ↓ Check ArgoCD ↓ Check Kubernetes Events ↓ Check Git History ↓ Check Cloud Logs […]
SREs Spend More Time Navigating Tools Than Fixing Problems. Read More »