Ask any experienced SRE what caused their worst outage.
It’s rarely:
• hardware failure
• massive traffic spike
• cloud provider outage
More often, it’s something like:
“We just changed a small config.”
Why Config Changes Are So Dangerous
In Kubernetes environments, configuration is everywhere:
• Deployment YAML
• Helm values
• ConfigMaps
• Secrets
• Autoscaling rules
• Resource limits
• Feature flags
A single change in any of these can alter system behavior significantly.
And unlike code changes, config changes often:
• bypass deep testing
• are applied quickly
• are not fully validated in production context
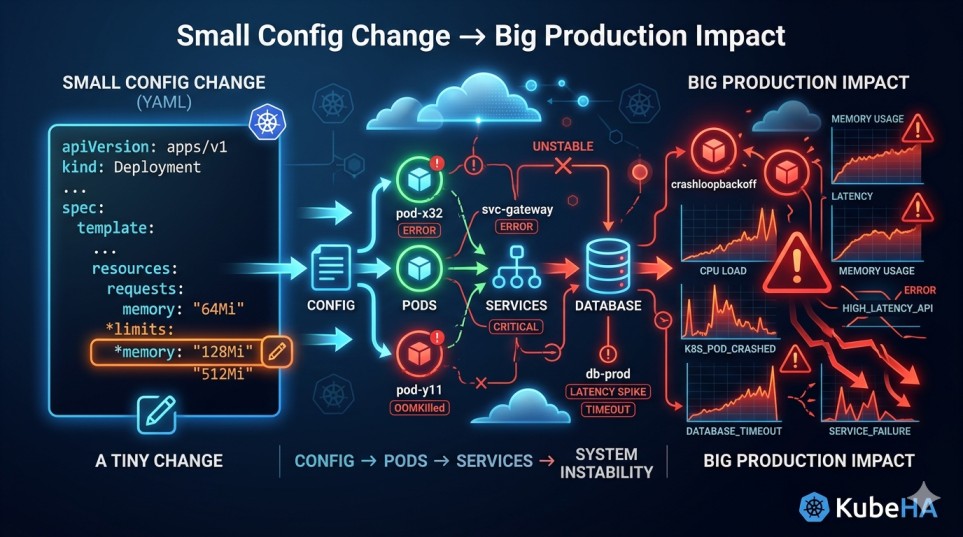
The Hidden Impact of “Small” Changes
Consider a simple update:
resources:
limits:
memory: 512Mi → 256Mi
Looks harmless.
But under load:
• containers hit memory limits
• OOMKills increase
• pods restart frequently
• latency increases
• retries amplify load
Result: production instability.
Real Incident Pattern Change:
• connection pool size reduced
• timeout value adjusted
• retry logic updated
Symptoms:
• increased latency
• intermittent failures
• cascading service degradation
Root Cause:
• dependency saturation
• increased retry amplification
• resource contention
Most engineers initially debug:
• logs
• metrics
• failing service
But the actual root cause lies in a recent config change.
Why These Issues Are Hard to Detect
1. No Immediate Failure
The system doesn’t crash instantly.
It degrades gradually.
2. Signals Are Misleading
You see:
• CPU normal
• memory stable
• pods running
But hidden issues exist:
• connection exhaustion
• latency spikes
• retry storms
3. Lack of Change Visibility
Teams often don’t track:
• what exactly changed
• when it changed
• which resources were affected
• how behavior shifted after the change
Without this, debugging becomes guesswork.
The Real Challenge: Change-to-Impact Correlation
During incidents, the most important question is:
“What changed just before this issue started?”
But answering this requires:
• tracking deployment and config history
• correlating it with metrics and logs
• understanding system behavior over time
Most teams do this manually.
And that takes time.
What Advanced SRE Teams Do
High-maturity teams treat configuration as runtime behavior control, not just static data.
They focus on:
• change tracking across all resources
• version comparison of configurations
• correlation with system metrics
• impact analysis after deployment
They don’t just ask:
“What is failing?”
They ask:
“What changed that caused this?”
How KubeHA Helps
KubeHA is designed to bridge the gap between config changes and system behavior.
 Change Detection
KubeHA tracks:
• deployment updates
• config changes (ConfigMaps, Secrets, Helm values)
• resource modifications
 Change-to-Impact Correlation
Instead of manually investigating, KubeHA shows insights like:
“Error rate increased after config change in payment-service. Memory limits reduced. Pod restarts increased.”
 Root Cause Identification
KubeHA connects:
• config changes
• pod behavior
• metrics anomalies
• events
into a single narrative.
 Faster Incident Resolution
Instead of spending time asking:
 “Is this a code issue?” “Is this infra?”
You immediately see:
 “Issue started after config change. Here is the impact.”
Real Outcome for Teams
Teams using change correlation (like KubeHA) achieve:
• faster MTTR
• fewer false debugging paths
• safer deployments
• better system stability
Final Thought
In Kubernetes, configuration is not passive.
It actively controls how your system behaves.
A “small” config change is never small in a distributed system.
The difference between a quick fix and a major outage often comes down to:
How fast you can connect a change to its impact.
 To learn more about Kubernetes configuration management, change impact analysis, and production reliability, follow KubeHA (https://linkedin.com/showcase/kubeha-ara/).
Book a demo today at https://kubeha.com/schedule-a-meet/
Experience KubeHA today: www.KubeHA.com
KubeHA’s introduction, https://www.youtube.com/watch?v=PyzTQPLGaD0
#DevOps #sre #monitoring #observability #remediation #Automation #kubeha #IncidentResponse #AlertRecovery #prometheus #opentelemetry #grafana, #loki #tempo #trivy #slack #Efficiency #ITOps #SaaS #ContinuousImprovement #Kubernetes #TechInnovation #StreamlineOperations #ReducedDowntime #Reliability #ScriptingFreedom #MultiPlatform #SystemAvailability #srexperts23 #sredevops #DevOpsAutomation #EfficientOps #OptimizePerformance #Logs #Metrics #Traces #ZeroCode