Author name: admin

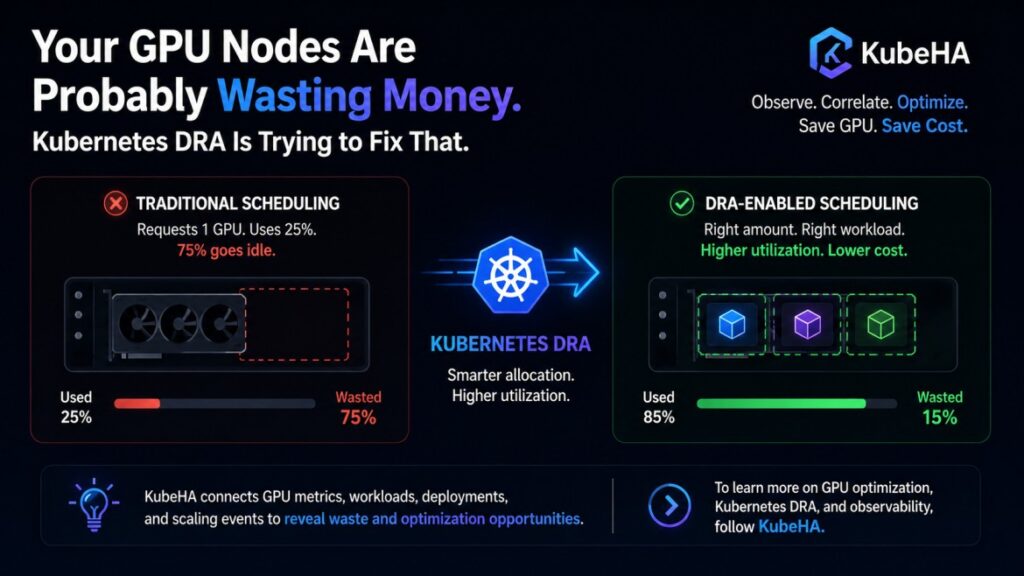
Your GPU Nodes Are Probably Wasting Money. Kubernetes DRA Is Trying to Fix That.

GPU workloads changed Kubernetes. LLMs.Inference services.Training pipelines.Vector search. But GPU scheduling in Kubernetes has lagged behind for years. The result? Many Kubernetes clusters silently waste thousands of dollars because GPUs remain underutilized. And most teams don’t even notice. Why GPU Utilization Is a Hidden Problem Traditional Kubernetes scheduling treats GPUs as coarse resources: Example: resources: […]

Your GPU Nodes Are Probably Wasting Money. Kubernetes DRA Is Trying to Fix That. Read More »

Your Observability Stack May Be Costing More Than Your Outages.

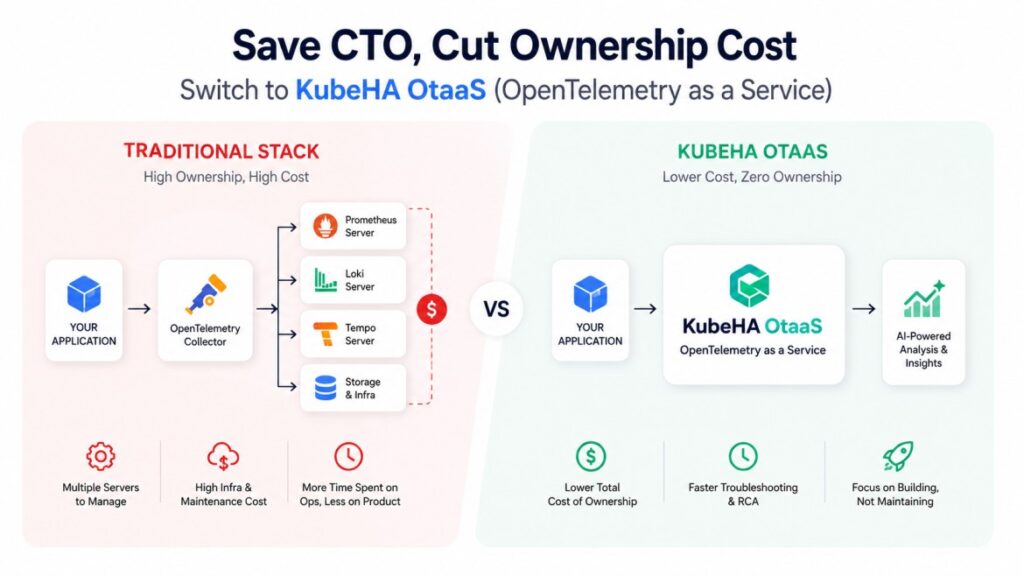
Many teams spend heavily maintaining: ❌ OpenTelemetry Collectors❌ Prometheus infrastructure❌ Loki clusters for logs❌ Tempo for traces❌ Storage, scaling, upgrades & backups❌ Dedicated engineers managing observability tooling The hidden cost isn’t only cloud bills – it’s ownership cost. With KubeHA OtaaS (OpenTelemetry as a Service), engineering teams can focus on products instead of operating observability

Your Observability Stack May Be Costing More Than Your Outages. Read More »

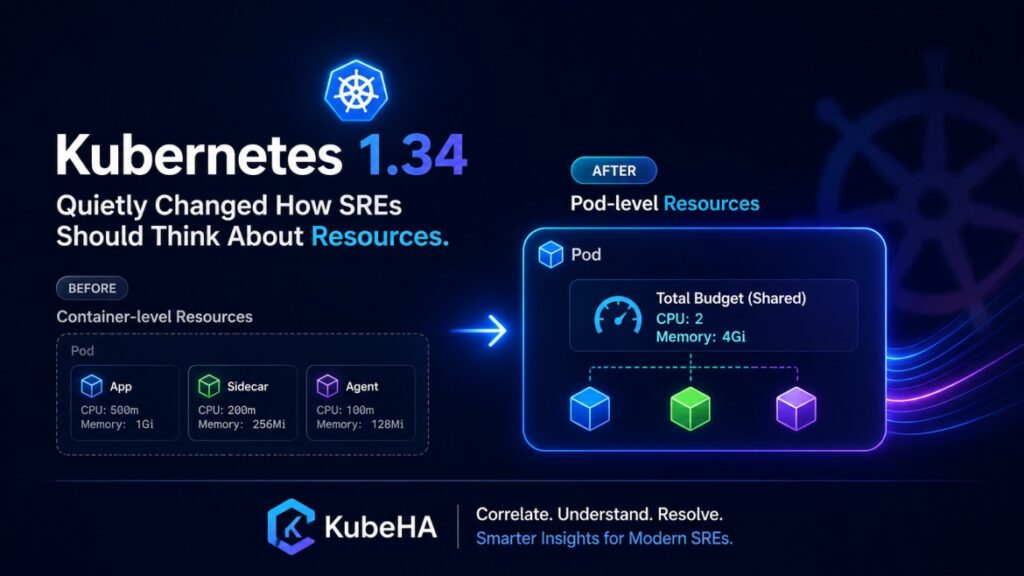
Kubernetes 1.34 Quietly Changed How SREs Should Think About Resources.

Kubernetes 1.34 Quietly Changed How SREs Should Think About Resources. Most engineers upgraded Kubernetes 1.34 and focused on release highlights. Few noticed a change that may significantly alter resource planning, autoscaling behavior, and workload optimization: Kubernetes now supports Pod-level resource requests and limits (Beta), and HPA can use them. This sounds minor. It isn’t. Why

Kubernetes 1.34 Quietly Changed How SREs Should Think About Resources. Read More »

Kubernetes Autoscaling Hides Problems Instead of Fixing Them.

Autoscaling is one of the most celebrated features in Kubernetes. Traffic increases?Add more pods. CPU spikes?Scale horizontally. Everything appears automated and resilient. But in many production environments, autoscaling does not actually solve the underlying problem. It often hides it. And sometimes, it amplifies it. The Common Assumption About Autoscaling Most teams assume: “If the application

Kubernetes Autoscaling Hides Problems Instead of Fixing Them. Read More »

Stop Guessing. Start Knowing.

🚀 Stop Guessing. Start Knowing. Self-Host Intelligence for Kubernetes Debugging & Deployment Management Kubernetes doesn’t fail silently.It fails everywhere at once – logs, metrics, deployments, configs, alerts. And most teams?They’re stuck jumping between tools, trying to piece together the story. 🔍 What if your cluster could explain itself? With KubeHA, you can: ✅ Self-host directly

Stop Guessing. Start Knowing. Read More »

Most Kubernetes Monitoring Setups Are Just Expensive Dashboards.

Most teams believe they have observability because they have dashboards. Grafana panels.Prometheus metrics.Alerting rules. Everything looks “covered.” But during a real production incident, something becomes obvious: Dashboards show data. They don’t explain systems. The Illusion of Monitoring Typical Kubernetes monitoring setups provide: • CPU and memory graphs• request rate and error rate• latency percentiles• pod

Most Kubernetes Monitoring Setups Are Just Expensive Dashboards. Read More »

Still Running 4+ Tools for Observability? You’re Paying More Than You Think.

Most teams today stitch together:• OpenTelemetry• Prometheus• Loki• Tempo And then spend months integrating, maintaining, scaling, and troubleshooting them. 👉 That’s not just complexity – that’s hidden TCO (Total Cost of Ownership). 💡 What if you could replace all of this with ONE platform? Introducing KubeHA – your GenAI-powered Observability + Automation platform 🔥 What

Still Running 4+ Tools for Observability? You’re Paying More Than You Think. Read More »

Most Production Incidents Start With a “Small” Config Change.

Ask any experienced SRE what caused their worst outage. It’s rarely: • hardware failure• massive traffic spike• cloud provider outage More often, it’s something like: “We just changed a small config.” Why Config Changes Are So Dangerous In Kubernetes environments, configuration is everywhere: • Deployment YAML• Helm values• ConfigMaps• Secrets• Autoscaling rules• Resource limits• Feature

Most Production Incidents Start With a “Small” Config Change. Read More »

Self-Host Observability in Fully Air-Gapped Environments – Meet KubeHA

In highly regulated industries like Insurance 🛡️ and Healthcare 🏥, sending telemetry data outside the cluster is simply not an option. But here’s the challenge:👉 How do you achieve modern observability without internet access?👉 How do you correlate logs, metrics, traces, and events when everything must stay inside your environment? 💡 KubeHA solves this. With

Self-Host Observability in Fully Air-Gapped Environments – Meet KubeHA Read More »

Helm Charts Are Just YAML Complexity Wrapped in YAML.

Helm was supposed to simplify Kubernetes deployments. But in many cases, it just hides complexity instead of reducing it. The Reality Helm introduces: • nested templates• multiple values files• conditional logic (if, range, include)• environment-specific overrides What you deploy is often very different from what you think you deployed. The Real Problem When something breaks,

Helm Charts Are Just YAML Complexity Wrapped in YAML. Read More »

Observability Without Correlation Is Just Noise.

Modern systems generate massive amounts of data. Logs.Metrics.Traces.Events. On paper, this looks like full observability. In reality: More data ≠ more understanding. Without correlation, observability becomes overwhelming noise. The Illusion of Observability Most teams invest heavily in: • Prometheus (metrics)• Loki / ELK (logs)• Tempo / Jaeger (traces)• Kubernetes events Each tool works well individually.

Observability Without Correlation Is Just Noise. Read More »

Scroll to Top