
GPU workloads changed Kubernetes.
LLMs.
Inference services.
Training pipelines.
Vector search.
But GPU scheduling in Kubernetes has lagged behind for years.
The result?
Many Kubernetes clusters silently waste thousands of dollars because GPUs remain underutilized.
And most teams don’t even notice.
Why GPU Utilization Is a Hidden Problem
Traditional Kubernetes scheduling treats GPUs as coarse resources:
Example:
resources:
limits:
nvidia.com/gpu: 1
If a Pod requests:
1 GPU
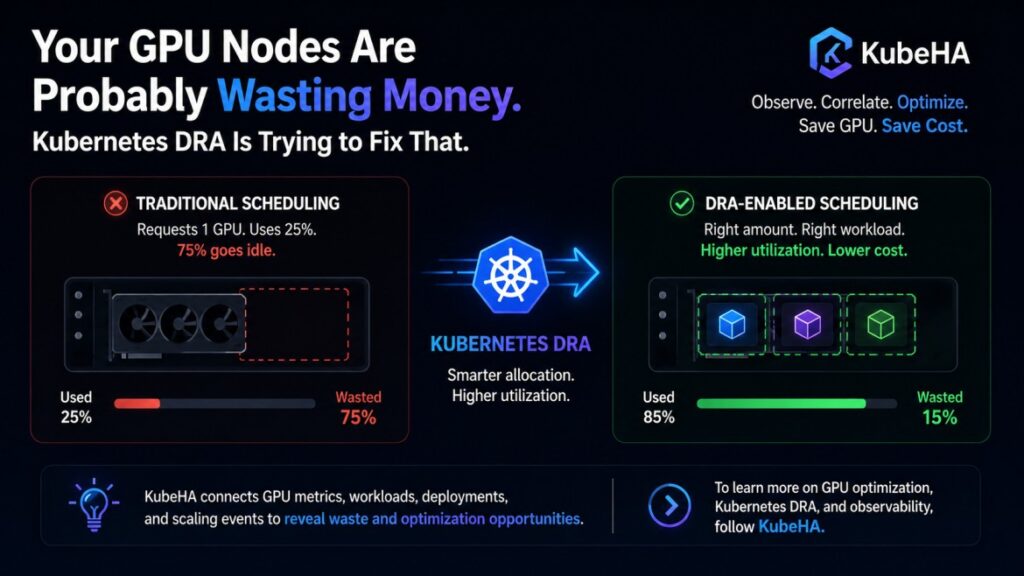
Kubernetes reserves the entire GPU.
Even if actual workload uses:
20–40%
The remaining capacity often sits idle.
This creates:
• GPU fragmentation
• stranded capacity
• unnecessary node scaling
• higher cloud costs
Why This Is Expensive
Consider:
8 × GPU node
Actual workload:
Inference service uses:
GPU utilization = 25%
Kubernetes still reserves:
1 full GPU
Unused GPU capacity:
≈ 75%
Multiply this across environments:
Production
Staging
ML experiments
Fine-tuning jobs
Infrastructure waste becomes substantial.
The Traditional Workaround
Teams try:
• node affinity
• taints/tolerations
• custom schedulers
• GPU partitioning (MIG)
• manual workload placement
These help.
But operational complexity increases rapidly.
Kubernetes Dynamic Resource Allocation (DRA) Changes This
Recent Kubernetes releases advanced Dynamic Resource Allocation (DRA) toward production readiness. DRA aims to provide more flexible resource allocation, particularly useful for specialized hardware like GPUs and accelerators.
Instead of:
Request entire GPU
Future scheduling becomes closer to:
Request capability / portion / specific accelerator requirement
This enables:
• smarter GPU sharing
• better utilization
• workload-aware allocation
• reduced idle capacity
Potential impact:
Higher utilization → lower cost → improved efficiency
Why SREs Should Care
GPU scheduling is becoming an observability problem, not just an infrastructure problem.
Questions SRE teams will increasingly need to answer:
🔍 Why was another GPU node created?
Real demand or inefficient allocation?
🔍 Which workloads underutilize GPUs?
Training? Inference? Side processes?
🔍 Which deployments changed GPU consumption?
New model version? Config update?
🔍 Are autoscalers reacting to symptoms?
Or actual accelerator pressure?
GPU Efficiency Is More Than Utilization %
Typical dashboards show:
GPU Usage: 35%
That’s not enough.
Need deeper visibility:
• workload-level allocation
• scheduling decisions
• queue latency
• deployment changes
• scaling events
• idle accelerator time
Without correlation:
GPU cost optimization becomes guesswork.
The Hidden Risk: AI Workloads Increase Waste
LLM workloads amplify inefficiency:
Examples:
• idle inference replicas
• oversized GPU requests
• overprovisioned serving systems
• fragmented scheduling
Clusters appear healthy.
Budgets silently increase.
How KubeHA Helps
As Kubernetes scheduling evolves (DRA, GPU sharing, smarter allocators), understanding why resources behave a certain way becomes harder.
KubeHA helps correlate:
• GPU node scaling events
• workload deployments
• autoscaler activity
• resource consumption patterns
• Pod scheduling changes
• metrics anomalies
• restart behavior
Example Insight From KubeHA
Instead of seeing:
GPU nodes increased from 4 → 8
KubeHA surfaces:
“GPU scaling began after deployment v2.4 increased inference replica count. Average GPU utilization remained 32%, indicating resource over-allocation.”
That changes optimization entirely.
Teams move from:
❌ More nodes = more capacity
to:
✅ More nodes = why did allocation become inefficient?
Operational Benefits
Teams using correlation-driven visibility achieve:
• reduced GPU waste
• lower infrastructure cost
• improved scheduling efficiency
• better autoscaling decisions
• faster identification of resource bottlenecks
Final Thought
GPU infrastructure is becoming one of the largest Kubernetes costs.
The future challenge isn’t:
“How many GPUs do we have?”
The challenge is:
“How efficiently are workloads actually using them?”
Kubernetes DRA is pushing resource management toward smarter allocation.
Teams that learn these patterns early will optimize faster – and spend far less.
👉 To learn more about Kubernetes GPU scheduling, DRA, AI workload efficiency, and production resource optimization, follow KubeHA (https://linkedin.com/showcase/kubeha-ara/).
Book a demo today at https://kubeha.com/schedule-a-meet/
Experience KubeHA today: www.KubeHA.com
KubeHA’s introduction, https://www.youtube.com/watch?v=PyzTQPLGaD0
#DevOps #sre #monitoring #observability #remediation #Automation #kubeha #IncidentResponse #AlertRecovery #prometheus #opentelemetry #grafana, #loki #tempo #trivy #slack #Efficiency #ITOps #SaaS #ContinuousImprovement #Kubernetes #TechInnovation #StreamlineOperations #ReducedDowntime #Reliability #ScriptingFreedom #MultiPlatform #SystemAvailability #srexperts23 #sredevops #DevOpsAutomation #EfficientOps #OptimizePerformance #Logs #Metrics #Traces #ZeroCode