Most Kubernetes alerting systems were designed around one assumption:
If a metric crosses a threshold, something is wrong.
For years, SRE teams have built alerts around:
• CPU utilization
• Memory utilization
• Error rates
• Latency
• Pod restarts
• Disk usage
Yet despite having thousands of alerts, many organizations still struggle with:
• Alert fatigue
• High MTTR
• Escalation overload
• Missed root causes
Why?
Because most alerts tell you:
What happened.
They rarely tell you:
What changed before it happened.
And that missing context is often the difference between noise and insight.
The Problem With Traditional Alerts
Imagine this alert:
High API Latency
Current: 2.4s
Threshold: 1.0s
What should the engineer do?
Open Grafana.
Check logs.
Check deployments.
Check Kubernetes events.
Check dependencies.
Check traces.
The alert itself contains almost no context.
It simply reports a symptom.
Most Production Incidents Begin With Change
After years of postmortems across the industry, a recurring pattern emerges:
Most outages are triggered by:
• Deployments
• Configuration changes
• Secret rotations
• Infrastructure updates
• Scaling events
• Network policy changes
• Dependency upgrades
Not hardware failures.
Not spontaneous Kubernetes failures.
Changes.
A typical incident often looks like:
10:02 Deployment Started
 ↓
10:04 ConfigMap Updated
 ↓
10:06 Pods Restarted
 ↓
10:09 Dependency Latency Increased
 ↓
10:12 Error Rate Increased
 ↓
10:15 Alert Fired
Notice something important.
The alert arrives last.
The root cause happened 10–15 minutes earlier.
Why Alert Noise Keeps Growing
Modern Kubernetes environments continuously generate:
• Deployment events
• HPA events
• Node events
• Kubernetes warnings
• Application logs
• OpenTelemetry traces
• Metrics anomalies
Traditional monitoring systems treat these as separate streams.
As a result:
CPU Alert
Memory Alert
Error Rate Alert
Latency Alert
Pod Restart Alert
Five alerts.
One root cause.
The engineer still has to correlate everything manually.
Alerts Without Change Context Create False Investigations
Consider this alert:
CPU Utilization > 90% Possible causes:
• Traffic spike
• Memory leak
• Deployment bug
• Infinite loop
• Dependency slowdown
• Retry storm
The metric alone cannot distinguish between them.
Without change awareness, every investigation starts from zero.
Why Change Events Are More Valuable Than Most Metrics
A deployment event provides immediate context:
Deployment v4.2 rolled out A configuration change provides even more:
Timeout changed
from 5s → 2s
These events dramatically reduce investigation scope.
Instead of asking:
What happened?
Engineers can ask:
Did this change cause the issue?
That’s a much faster path to root cause.
The Future of Alerting
The next generation of observability won’t be:
Metric → Alert It will be:
Change
 ↓
Impact
 ↓
Alert
 ↓
Root Cause
Alerts become significantly more useful when enriched with:
• Deployment context
• Change history
• Trace correlation
• Event timelines
• Dependency relationships
This transforms alerts from notifications into explanations.
Why OpenTelemetry Makes This More Important
OpenTelemetry is rapidly standardizing:
• Metrics
• Logs
• Traces
But the industry is now realizing something important:
Observability isn’t a data collection problem anymore.
It’s a correlation problem.
The value comes from understanding:
What changed?
 ↓
What was impacted?
 ↓
Why?
Not from collecting another metric.
How KubeHA Helps
This is exactly where KubeHA changes the workflow.
Instead of showing isolated alerts, KubeHA correlates:
• Deployments
• Config changes
• Kubernetes events
• Pod restarts
• Logs
• Metrics
• Traces
• HPA activity
• Control plane events
into a single operational timeline.
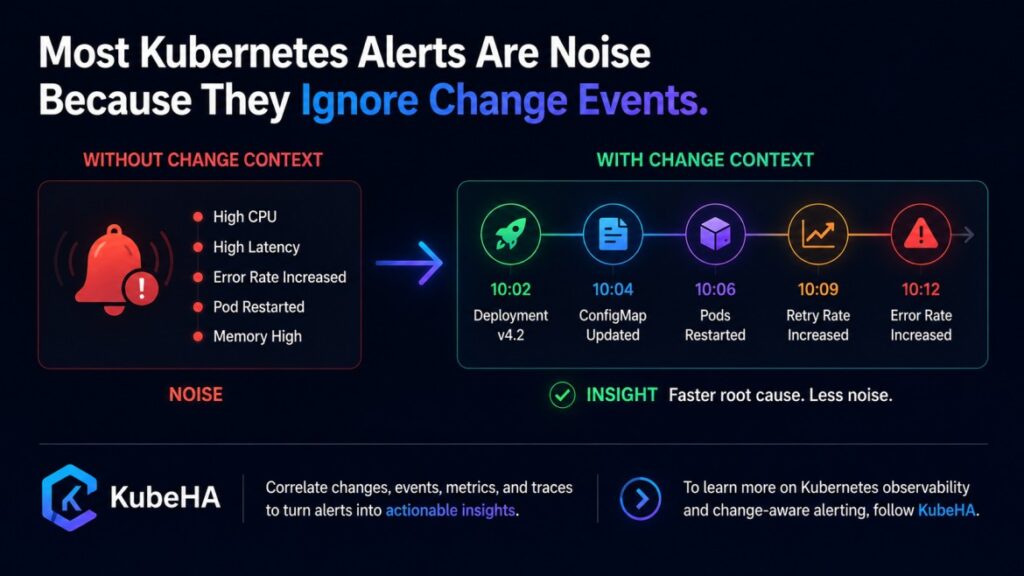
Example
Traditional Alert:
High Error Rate
5.2%
Engineer starts investigating.
KubeHA Alert:
10:02 Deployment v4.2
 ↓
10:04 ConfigMap Updated
 ↓
10:06 Pods Restarted
 ↓
10:09 Retry Rate Increased
 ↓
10:12 Error Rate Increased
Potential Root Cause:
Timeout reduced from 5s to 2s
causing dependency failures
The difference is massive.
One is an alert.
The other is an explanation.
Why This Matters for SRE Teams
As systems become more distributed, alert volume will continue increasing.
The winning strategy isn’t:
Create more alerts.
It’s:
Add more context to alerts.
Teams that embrace change-aware alerting gain:
• Lower MTTR
• Fewer false escalations
• Less alert fatigue
• Faster root cause identification
• Better operational efficiency
Final Thought
Most Kubernetes alerts are not actually wrong.
They’re incomplete.
The missing piece is often the most important piece:
What changed?
Once alerts understand change events, they stop being noise.
They become insight.
And that is where the future of incident response is heading.
👉 To learn more about Kubernetes alert correlation, change intelligence, OpenTelemetry observability, and modern SRE practices, follow KubeHA (https://linkedin.com/showcase/kubeha-ara/).
Book a demo today at https://kubeha.com/schedule-a-meet/
Experience KubeHA today: www.KubeHA.com
KubeHA’s introduction, https://www.youtube.com/watch?v=PyzTQPLGaD0
#DevOps #sre #monitoring #observability #remediation #Automation #kubeha #IncidentResponse #AlertRecovery #prometheus #opentelemetry #grafana, #loki #tempo #trivy #slack #Efficiency #ITOps #SaaS #ContinuousImprovement #Kubernetes #TechInnovation #StreamlineOperations #ReducedDowntime #Reliability #ScriptingFreedom #MultiPlatform #SystemAvailability #srexperts23 #sredevops #DevOpsAutomation #EfficientOps #OptimizePerformance #Logs #Metrics #Traces #ZeroCode.