
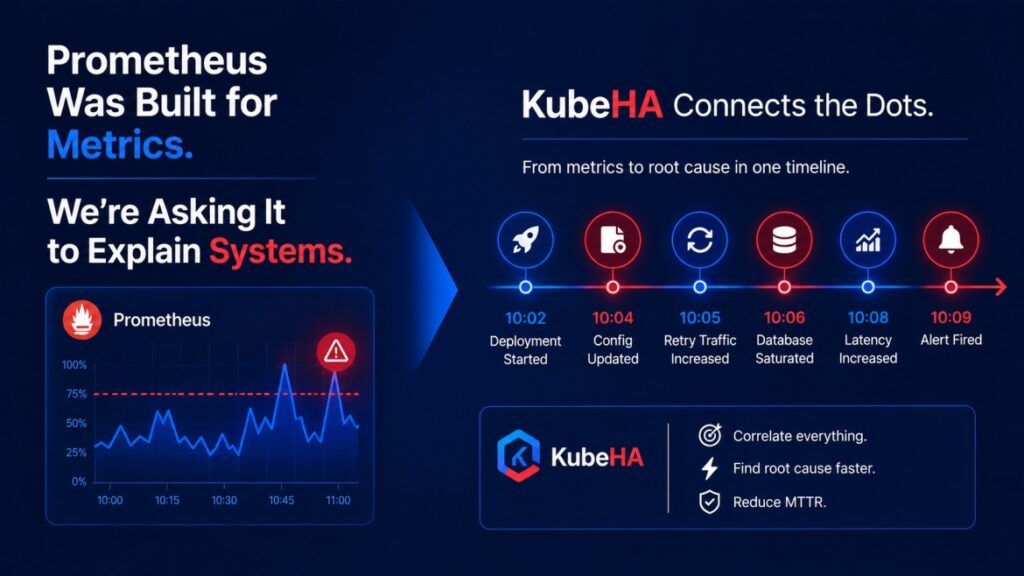
Prometheus Was Built for Metrics. We’re Asking It to Explain Systems.
For nearly a decade, Prometheus has been the gold standard for Kubernetes monitoring.
It revolutionized cloud-native observability by making metrics collection simple, scalable, and flexible.
CPU utilization.
Memory consumption.
HTTP request rates.
Latency.
Pod health.
Node health.
Without Prometheus, modern Kubernetes operations would look very different.
But somewhere along the way, we started expecting Prometheus to answer questions it was never designed to answer.
And that’s where many SRE investigations begin to struggle.
Prometheus Solved the Metrics Problem
When Prometheus was introduced, infrastructure monitoring was fragmented.
Traditional monitoring relied on:
Agent-based collection
Push models
Proprietary storage
Rigid dashboards
Prometheus introduced a different model:
Pull-based collection
Label-driven metrics
PromQL
Kubernetes-native service discovery
Time-series database optimized for numerical data
It answered questions like:
What is happening to my system?
For example:
rate(http_requests_total[5m])
or
container_memory_working_set_bytes
These metrics tell us what the system is doing.
And they do that extremely well.
The Problem Begins During Incidents
Imagine your alert fires:
Latency P95 > 2 seconds
Prometheus immediately shows:
Latency increased
Error rate increased
CPU stable
Memory stable
Great.
But then the next question appears.
Why?
This is where Prometheus reaches its design boundary.
Metrics Explain Symptoms
Metrics are numerical observations.
Examples:
CPU = 85%
Memory = 72%
Error Rate = 4%
Pod Restarts = 7
Metrics answer:
What changed?
They don’t explain:
Why latency increased
Why pods restarted
Why retries exploded
Why deployments failed
Why DNS became slow
That information lives elsewhere.
Modern Systems Are No Longer Metric-Only
A Kubernetes production incident rarely involves a single metric.
Instead it looks like:
Deployment Started
 ↓
Config Updated
 ↓
Pods Restarted
 ↓
Retry Rate Increased
 ↓
Database Saturated
 ↓
Latency Increased
 ↓
Alert Fired
Only one of these events is actually a metric.
The rest are:
Kubernetes Events
Deployments
Logs
Traces
Infrastructure Changes
Control Plane Activity
Prometheus doesn’t know these relationships.
Nor was it designed to.
We Keep Asking Prometheus Bigger Questions
Consider questions SREs ask every day.
Why did latency increase?
Prometheus:
Shows latency.
Cannot explain deployment history.
Why did pods restart?
Prometheus:
Shows restart count.
Doesn’t explain:
OOMKilled
Failed Mount
Config Error
CrashLoopBackOff reason
Why did API errors begin?
Prometheus:
Shows error rate.
Doesn’t know:
GitOps rollout
Secret rotation
Admission webhook delay
Dependency deployment
Why did autoscaling occur?
Prometheus:
Shows CPU.
Doesn’t explain:
Traffic spike
Retry storm
Network congestion
Database slowdown
Metrics Without Context Create Guesswork
This is why many investigations become:
Alert
 ↓
Prometheus
 ↓
Grafana
 ↓
Loki
 ↓
Tempo
 ↓
kubectl describe
 ↓
Events
 ↓
Git History
 ↓
Finally understand
Notice something.
Prometheus is just the first stop.
The engineer still spends most of the investigation gathering context.
The Cardinality Challenge
As Kubernetes environments grow, teams often respond by collecting:
More metrics
More labels
More recording rules
Eventually Prometheus stores millions of time series.
The result?
Higher storage costs.
Higher query latency.
Greater operational complexity.
Yet despite all those additional metrics…
The engineer still asks:
Why?
Collecting more metrics rarely answers that question.
Metrics Need Relationships
Modern observability is shifting from:
Metrics
toward
Metrics + Events + Logs + Traces + Changes
The value isn’t in each signal individually.
The value is understanding how they relate.
For example:
Deployment v3.5
 ↓
CPU unchanged
 ↓
Retry rate increased
 ↓
Database latency increased
 ↓
Error rate increased
Prometheus knows the metrics.
But something else has to connect the dots.
The Rise of Investigation-Centric Observability
The next generation of observability platforms won’t replace Prometheus.
Instead they’ll build on it.
Prometheus remains the metrics engine.
But investigations require:
Correlation
Timelines
Change intelligence
Dependency analysis
Root cause detection
Metrics become one input—not the entire story.
How KubeHA Helps
This is exactly where KubeHA provides value.
KubeHA doesn’t replace Prometheus.
It extends it.
KubeHA correlates Prometheus metrics with:
Kubernetes Events
Deployments
ConfigMap changes
Secret updates
Pod lifecycle
Loki logs
OpenTelemetry traces
eBPF networking events
Control plane telemetry
HPA activity
Instead of showing:
CPU 92%
Latency 2.4s
KubeHA shows:
10:02 Deployment Started
 ↓
10:04 Config Updated
 ↓
10:05 Retry Traffic Increased
 ↓
10:06 Database Saturated
 ↓
10:08 Latency Increased
 ↓
10:09 Prometheus Alert Fired
The engineer immediately understands the sequence of events.
Not just the symptom.
A Practical Example
Imagine a payment service suddenly experiences a latency spike.
Prometheus tells you:
P95 latency = 2.8 s
CPU = 45%
Memory = 60%
Request rate stable
Nothing obviously explains the issue.
KubeHA correlates additional signals:
Deployment completed 7 minutes earlier
ConfigMap changed retry timeout from 5 s to 2 s
OpenTelemetry traces show retry count doubled
eBPF reports increased TCP retransmissions to the database
Kubernetes events show HPA scaling after retries increased
Now the incident has a narrative.
The root cause is no longer hidden behind isolated metrics.
The Future Isn’t More Metrics
Over the next five years, I believe the biggest shift won’t be:
Better PromQL.
Or faster dashboards.
It will be moving from metric-centric operations to context-centric investigations.
Metrics remain critical.
But they become one chapter in a much larger operational story.
Final Thought
Prometheus transformed Kubernetes monitoring.
It remains one of the most important projects in cloud-native infrastructure.
But it was never designed to explain entire distributed systems.
It measures behavior.
It does not infer causality.
The future belongs to platforms that combine:
Metrics
Logs
Traces
Kubernetes events
Configuration changes
Infrastructure signals
AI-driven correlation
into one coherent investigation.
Because during an outage, engineers don’t need another graph.
They need an explanation.
And that’s where modern observability is heading.
 To learn more about Prometheus, Kubernetes observability, OpenTelemetry, incident correlation, and next-generation SRE workflows, follow KubeHA(https://linkedin.com/showcase/kubeha-ara/).
Book a demo today at https://kubeha.com/schedule-a-meet/
Experience KubeHA today: www.KubeHA.com
KubeHA’s introduction, https://www.youtube.com/watch?v=PyzTQPLGaD0
#DevOps #sre #monitoring #observability #remediation #Automation #kubeha #IncidentResponse #AlertRecovery #prometheus #opentelemetry #grafana, #loki #tempo #trivy #slack #Efficiency #ITOps #SaaS #ContinuousImprovement #Kubernetes #TechInnovation #StreamlineOperations #ReducedDowntime #Reliability #ScriptingFreedom #MultiPlatform #SystemAvailability #srexperts23 #sredevops #DevOpsAutomation #EfficientOps #OptimizePerformance #Logs #Metrics #Traces #ZeroCode.