Modern observability promised to make operations easier.
Instead, many SREs now spend their incident response time navigating between tools.
A typical production incident looks like this:
Alert Fired
 ↓
Open Grafana
 ↓
Open Prometheus
 ↓
Open Loki
 ↓
Open Tempo
 ↓
Check ArgoCD
 ↓
Check Kubernetes Events
 ↓
Check Git History
 ↓
Check Cloud Logs
 ↓
Start Investigation
Notice something strange.
The first 15–20 minutes are often spent finding information, not solving the problem.
The Hidden Cost of Tool Sprawl
Most modern Kubernetes environments contain:
Monitoring
• Prometheus
• Grafana
Logging
• Loki
• ELK
• OpenSearch
Tracing
• Tempo
• Jaeger
Deployments
• ArgoCD
• Flux
Incident Management
• PagerDuty
• Opsgenie
Cloud Platforms
• AWS
• Azure
• GCP
Kubernetes
• kubectl
• Events
• Audit Logs
Every tool solves a specific problem.
But incidents rarely stay within a single tool boundary.
A Real Production Incident
Imagine a latency alert:
Latency > 2 seconds
The investigation often becomes:
Step 1
Open Grafana.
Latency confirmed.
Step 2
Open Prometheus.
Error rate increasing.
Step 3
Open Loki.
Timeout errors visible.
Step 4
Open Tempo.
Requests slowing in downstream service.
Step 5
Open ArgoCD.
Deployment happened 10 minutes earlier.
Step 6
Check Kubernetes Events.
Pods restarted after rollout.
Step 7
Finally identify root cause.
At this point:
30 minutes have passed.
The Problem Isn’t Lack of Data
Most teams have more observability data than ever before.
They have:
• metrics
• logs
• traces
• events
• deployments
• audits
The challenge is no longer:
“Can we collect the data?”
The challenge is:
“Can we connect the data?”
Every Tool Shows a Different Piece of Reality
Prometheus answers:
What changed?
Metrics.
Loki answers:
What was logged?
Logs.
Tempo answers:
Where did the request go?
Traces.
Kubernetes events answer:
What happened in the cluster?
Events.
GitOps tools answer:
What changed in configuration?
Deployments.
The problem:
No single tool explains the entire incident.
The engineer becomes the correlation engine.
Why This Doesn’t Scale
As environments grow:
• more microservices
• more clusters
• more telemetry
• more alerts
Tool switching grows exponentially.
Engineers spend more time building mental models than resolving incidents.
This increases:
• MTTR
• alert fatigue
• burnout
• operational risk
The Industry Is Moving Toward Context, Not More Tools
The next evolution of observability is not:
More dashboards
or
More telemetry
It is:
More correlation
Because context eliminates investigation time.
The Future Incident Workflow
Instead of:
Alert
 ↓
10 different tools
 ↓
Manual correlation
 ↓
Root Cause
Teams want:
Alert
 ↓
Timeline
 ↓
Correlation
 ↓
Root Cause
The difference is enormous.
How KubeHA Helps
KubeHA was built around a simple idea:
Engineers should spend time solving incidents, not gathering evidence.
Instead of forcing SREs to jump between tools, KubeHA correlates:
• Kubernetes events
• Deployments
• Config changes
• Prometheus metrics
• Loki logs
• Tempo traces
• Pod restarts
• HPA activity
• Control plane signals
into a single investigation timeline.
Example
Without KubeHA:
Grafana
 ↓
Prometheus
 ↓
Loki
 ↓
Tempo
 ↓
ArgoCD
 ↓
kubectl events
 ↓
Root Cause
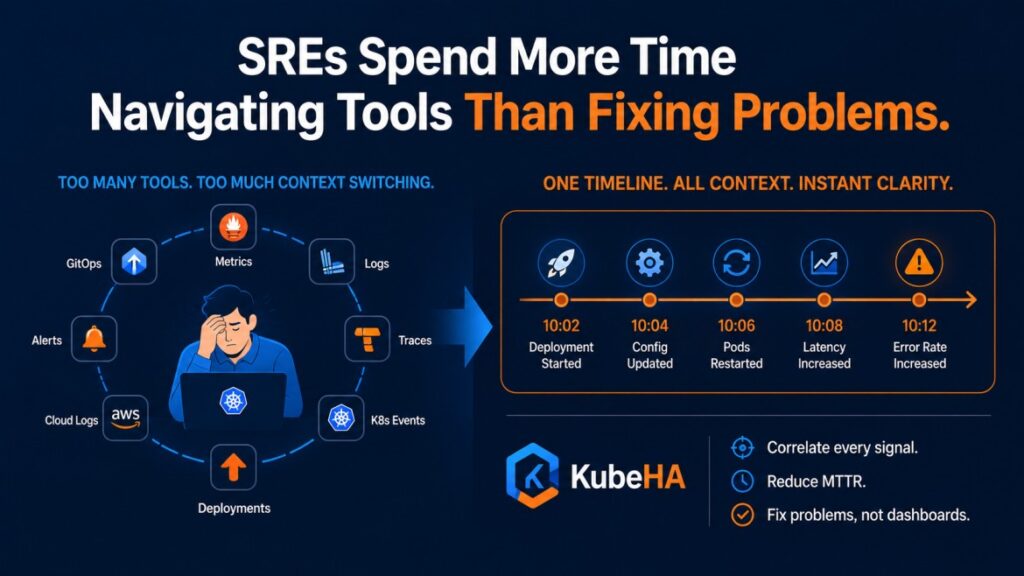
With KubeHA:
10:02 Deployment Started
 ↓
10:04 Config Updated
 ↓
10:06 Pods Restarted
 ↓
10:08 Dependency Latency Increased
 ↓
10:12 Error Rate Increased
 ↓
Root Cause Identified
Everything is already correlated.
Why This Matters
The best SRE teams are not necessarily the ones with the most tools.
They’re the teams that can answer:
What happened?
Why did it happen?
What should we do next?
Faster than everyone else.
The Bigger Trend
Over the next few years, observability platforms will increasingly move toward:
Correlation
Connecting signals.
Timelines
Showing causality.
Investigation Workflows
Not dashboards.
AI-Assisted Analysis
Explaining incidents instead of merely displaying data.
This is where the industry is heading.
Final Thought
Most SRE teams don’t have a monitoring problem.
They have a navigation problem.
The challenge isn’t finding another dashboard.
The challenge is reducing the number of places engineers must look before they understand the issue.
Because every minute spent switching tools is a minute not spent resolving the incident.
 To learn more about Kubernetes observability, incident correlation, timeline-driven debugging, and modern SRE practices, follow KubeHA (https://linkedin.com/showcase/kubeha-ara/).
Book a demo today at https://kubeha.com/schedule-a-meet/
Experience KubeHA today: www.KubeHA.com
KubeHA’s introduction, https://www.youtube.com/watch?v=PyzTQPLGaD0
#DevOps #sre #monitoring #observability #remediation #Automation #kubeha #IncidentResponse #AlertRecovery #prometheus #opentelemetry #grafana, #loki #tempo #trivy #slack #Efficiency #ITOps #SaaS #ContinuousImprovement #Kubernetes #TechInnovation #StreamlineOperations #ReducedDowntime #Reliability #ScriptingFreedom #MultiPlatform #SystemAvailability #srexperts23 #sredevops #DevOpsAutomation #EfficientOps #OptimizePerformance #Logs #Metrics #Traces #ZeroCode.