
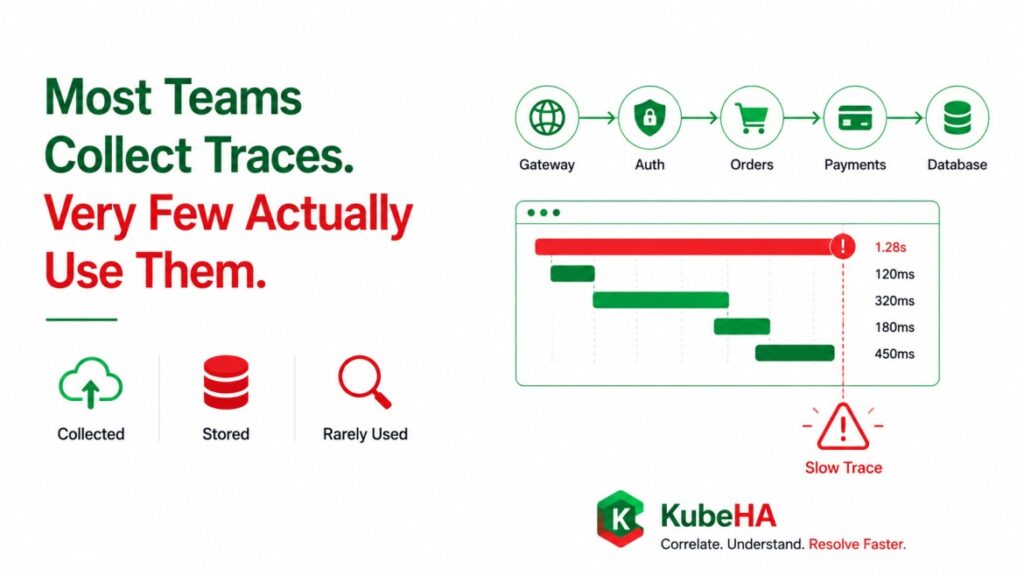
Distributed tracing was supposed to change everything.
Finally, we could see how a request flows across microservices:
Gateway → Auth → Orders → Payments → Database We could measure latency at every hop.
We could identify slow services.
We could debug complex systems.
And yet, in many production environments today:
Traces are collected. Stored. Rarely used during real incidents.
Why?
Because collecting traces is easy.
Using them effectively is hard.
The Promise of Distributed Tracing
With tools like:
- OpenTelemetry
- Tempo
- Jaeger
- Zipkin
we can capture:
• spans • parent-child relationships • request timelines • service dependencies • latency breakdowns
A typical trace shows:
Request A
 ├── Auth Service (20ms)
 ├── Payment Service (180ms)
 ├── Inventory Service (40ms)
 └── Database (220ms)
This looks incredibly powerful.
But during a real incident, something breaks down.
What Actually Happens During an Incident
Alert fires:
P95 Latency > 2.5s Engineer reaction:
- Open Grafana
- Confirm latency spike
- Open logs
- Check deployments
- Check Kubernetes events
At some point, someone says:
“Let’s check traces.”
They open Tempo/Jaeger.
Search for a slow trace.
Find one.
Look at spans.
And then…
They get stuck.
Why Traces Alone Are Not Enough
A trace tells you:
Where time was spent in a single request.
It does not tell you:
• What changed before this request • Whether a deployment triggered the issue • If retries increased system load • If DNS latency increased • If Kubernetes rescheduled pods • If network issues caused delays • If autoscaling amplified the problem
A trace is a snapshot.
An incident is a sequence.
The Core Problem: Lack of Context
Let’s say a trace shows:
Payment Service = 800ms Why?
Possible reasons:
- New deployment introduced slow logic
- Database queries became inefficient
- Network latency increased
- Downstream dependency degraded
- Retry logic triggered
- Circuit breaker misconfigured
The trace does not answer this.
It only shows the symptom.
The “Trace Hunting” Problem
Most teams use traces like this:
Find slow trace
 ↓
Inspect spans
 ↓
Guess cause
This becomes:
• manual • time-consuming • inconsistent • dependent on experience
In large systems, there may be:
- millions of traces
- thousands of slow spans
- multiple concurrent issues
Finding the “right” trace becomes a challenge itself.
Why Traces Are Underutilized
1. No Correlation With Changes
Traces are rarely connected to:
- deployments
- config changes
- feature flags
- infra updates
2. No Timeline Context
You don’t see:
What happened before this trace? 3. No System-Level View
Each trace represents:
one request But incidents affect:
entire systems 4. Too Much Data
Tracing systems generate massive volumes.
Without filtering and correlation:
More traces = more confusion
The Missing Link: Traces Need Context
Imagine combining traces with:
Deployment Events
Kubernetes Events
Metrics
Logs
eBPF Signals
Autoscaling Activity
Now the same trace becomes part of a story:
10:02 Deployment v4.2
 ↓
10:04 Config Change
 ↓
10:05 Retry Count Increased (trace)
 ↓
10:06 Database Latency Increased
 ↓
10:07 Payment Service Span = 800ms
 ↓
10:08 Error Rate Increased
Now the trace is useful.
Because it is connected.
The Future of Tracing
Tracing is not going away.
It’s becoming foundational.
But its role is evolving.
From:
Standalone debugging tool to:
One signal in a correlated system The real value comes from:
• trace + change • trace + metrics • trace + logs • trace + infrastructure events
How KubeHA Helps
KubeHA transforms traces from isolated data into actionable insights.
🔗 Correlation Across Signals
KubeHA connects:
- OpenTelemetry traces
- Prometheus metrics
- Loki logs
- Kubernetes events
- Deployment history
- Config changes
- HPA activity
- eBPF network signals
⏱️ Timeline-Based Investigation
Instead of searching for traces manually, KubeHA shows:
What happened → in order → across the system 🧠 Root Cause Context
Instead of:
Payment Service = 800ms You see:
Payment Service latency increased after deployment v4.2
due to retry amplification caused by reduced timeout
⚡ Faster Incident Resolution
Engineers no longer need to:
- hunt for traces
- guess relationships
- manually correlate signals
They can directly:
→ understand the system behavior → identify root cause → resolve faster
Real Impact for SRE Teams
Teams that properly use tracing with correlation achieve:
• lower MTTR • fewer blind investigations • better system understanding • reduced alert fatigue • more confident debugging
Final Thought
Tracing is one of the most powerful tools in modern observability.
But only when used correctly.
Most teams stop at:
“We have traces.”
Very few reach:
“We understand what our traces are telling us.”
Because traces alone don’t explain systems.
They need context.
They need correlation.
They need a story.
And the future of observability is not about collecting more traces.
It’s about making them meaningful.
👉 To learn more about distributed tracing, OpenTelemetry, Kubernetes observability, and correlation-driven debugging, follow KubeHA (https://linkedin.com/showcase/kubeha-ara/).
Book a demo today at https://kubeha.com/schedule-a-meet/
Experience KubeHA today: www.KubeHA.com
KubeHA’s introduction, https://www.youtube.com/watch?v=PyzTQPLGaD0
#DevOps #sre #monitoring #observability #remediation #Automation #kubeha #IncidentResponse #AlertRecovery #prometheus #opentelemetry #grafana, #loki #tempo #trivy #slack #Efficiency #ITOps #SaaS #ContinuousImprovement #Kubernetes #TechInnovation #StreamlineOperations #ReducedDowntime #Reliability #ScriptingFreedom #MultiPlatform #SystemAvailability #srexperts23 #sredevops #DevOpsAutomation #EfficientOps #OptimizePerformance #Logs #Metrics #Traces #ZeroCode.