
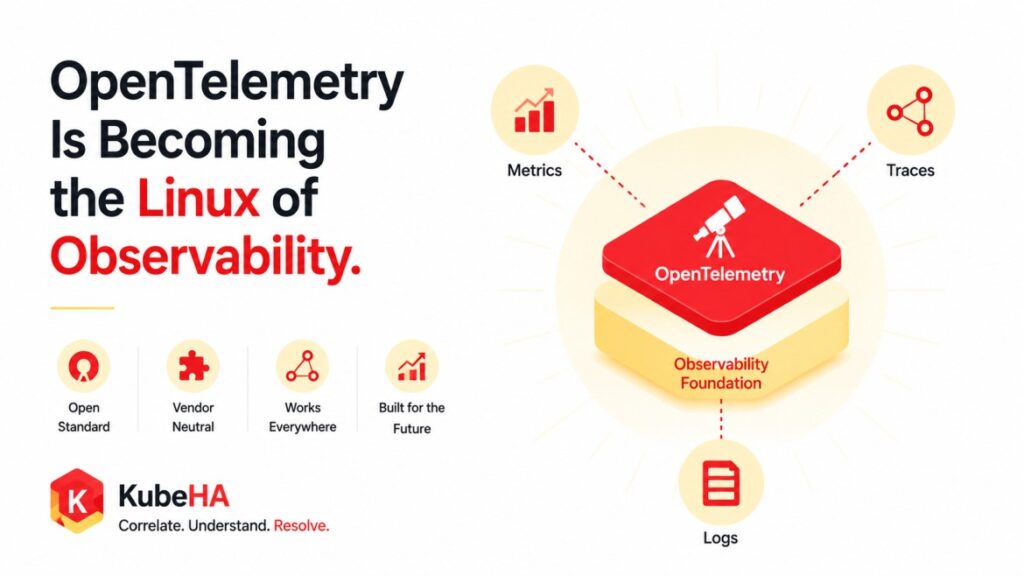
OpenTelemetry Is Becoming the Linux of Observability.
There was a time when observability was fragmented.
Metrics came from one system.
Logs from another.
Tracing required a completely different setup.
Every vendor had its own SDKs, formats, and pipelines.
Then something similar to what happened in operating systems began to emerge.
A common, open foundation.
Just like Linux became the standard layer for computing…
OpenTelemetry is becoming the standard layer for observability.
Before OpenTelemetry: A Fragmented World
In the past, instrumenting an application meant vendor lock-in.
You had to choose:
Datadog SDK
New Relic agent
AppDynamics tracer
Custom logging pipelines
Each came with:
• proprietary formats
• custom instrumentation
• migration complexity
• high switching cost
Changing vendors often meant rewriting large parts of your observability stack.
What OpenTelemetry Actually Changed
OpenTelemetry didn’t just introduce another tool.
It introduced a standard.
A standard for:
Metrics
Logs
Traces
Context propagation
Now, instead of:
App → Vendor SDK → Vendor Backend
We have:
App → OpenTelemetry → Any Backend
This is exactly what Linux did for infrastructure:
Hardware → Linux → Applications
OpenTelemetry sits between your application and your observability tools.
Why “Linux of Observability” Is Not an Overstatement
Linux succeeded because it became:
• open
• portable
• extensible
• vendor-neutral
OpenTelemetry is following the same path.
 Vendor Neutrality
You can send telemetry to:
Prometheus
Grafana
Datadog
New Relic
Splunk
Custom backends
Without changing application instrumentation.
Standardized Data Model
Instead of every tool defining its own format:
OpenTelemetry defines:
semantic conventions
span structures
metric naming
context propagation
This enables interoperability across tools.
Extensibility
Collectors can:
transform data
filter signals
route telemetry
enrich context
This creates flexible observability pipelines.
Ecosystem Growth
Just like Linux enabled an ecosystem:
Kubernetes
Docker
Cloud platforms
OpenTelemetry is enabling:
unified observability stacks
multi-tool architectures
vendor-agnostic pipelines
But There’s a Catch
Linux solved portability.
It did not solve application complexity.
Similarly:
OpenTelemetry solves data collection, not understanding.
Even with OpenTelemetry, teams still face:
• too many traces
• too many metrics
• too many logs
• too many alerts
Observability improved.
Understanding did not scale at the same rate.
The New Problem: Too Much Telemetry
Modern systems generate:
Millions of metrics
Billions of spans
Huge volumes of logs
Example:
Trace shows latency increased
But why?
Because:
deployment changed?
config updated?
dependency slowed?
DNS failed?
retry storm triggered?
OpenTelemetry captures the signals.
But correlation still depends on humans or higher-level systems.
OpenTelemetry + eBPF + Kubernetes = Complete Visibility
Modern observability stacks now include:
OpenTelemetry
Application-level visibility
Request flows
Distributed tracing
eBPF
Kernel-level visibility
Networking
System calls
Packet-level insights
Kubernetes
Scheduling
Events
Resource changes
Control plane signals
Prometheus / Loki / Tempo
Metrics
Logs
Traces
We now have full visibility across the stack.
But visibility alone doesn’t solve incidents.
The Missing Layer: Correlation
Consider this timeline:
10:02 Deployment Started
 ↓
10:03 OpenTelemetry trace latency increased
 ↓
10:04 eBPF shows TCP retransmissions
 ↓
10:05 Kubernetes event: Pods restarted
 ↓
10:06 Error rate increased
 ↓
10:07 Alert fired
Each system provides part of the picture.
OpenTelemetry shows latency.
eBPF shows network behavior.
Kubernetes shows orchestration events.
But something must connect them.
How KubeHA Helps
This is where KubeHA fits in the stack.
KubeHA doesn’t replace OpenTelemetry.
It builds on top of it.
 Correlating OpenTelemetry Data
KubeHA connects:
traces
spans
latency signals
with:
deployments
config changes
Kubernetes events
HPA activity
 Turning Telemetry Into Explanation
Instead of:
Trace latency increased
KubeHA shows:
Deployment v3.2
 ↓
Config change applied
 ↓
Retry count increased (trace)
 ↓
Database latency increased
 ↓
Error rate increased
 Timeline-Based Investigation
KubeHA organizes:
OpenTelemetry traces
Kubernetes events
logs
metrics
eBPF signals
into a single timeline.
This reduces:
• tool switching
• manual correlation
• MTTR
 Faster Root Cause Identification
Instead of asking:
Which trace should I look at?
Engineers see:
What sequence of events caused the issue?
That’s a fundamental shift.
What This Means for SREs
OpenTelemetry will continue to grow.
It will likely become:
default instrumentation layer
standard across cloud-native systems
required for modern observability
But the most valuable skill will not be:
“How to instrument applications”
It will be:
“How to interpret correlated telemetry across systems”
The Bigger Industry Trend
The future stack will look like:
OpenTelemetry → Collects data
eBPF → Expands visibility
Kubernetes → Generates events
KubeHA → Connects everything
Collection is becoming standardized.
Correlation is becoming the differentiator.
Final Thought
Linux didn’t win because it had the best features.
It won because it became the foundation everything else built on.
OpenTelemetry is doing the same for observability.
But just like Linux didn’t eliminate complexity…
OpenTelemetry won’t eliminate the need for understanding systems.
Because during an incident, engineers don’t need more telemetry.
They need clarity.
And clarity comes from correlation.
 To learn more about OpenTelemetry, Kubernetes observability, eBPF, and correlation-driven incident debugging, follow KubeHA (https://linkedin.com/showcase/kubeha-ara/).
Book a demo today at https://kubeha.com/schedule-a-meet/
Experience KubeHA today: www.KubeHA.com
KubeHA’s introduction, https://www.youtube.com/watch?v=PyzTQPLGaD0
#DevOps #sre #monitoring #observability #remediation #Automation #kubeha #IncidentResponse #AlertRecovery #prometheus #opentelemetry #grafana, #loki #tempo #trivy #slack #Efficiency #ITOps #SaaS #ContinuousImprovement #Kubernetes #TechInnovation #StreamlineOperations #ReducedDowntime #Reliability #ScriptingFreedom #MultiPlatform #SystemAvailability #srexperts23 #sredevops #DevOpsAutomation #EfficientOps #OptimizePerformance #Logs #Metrics #Traces #ZeroCode.