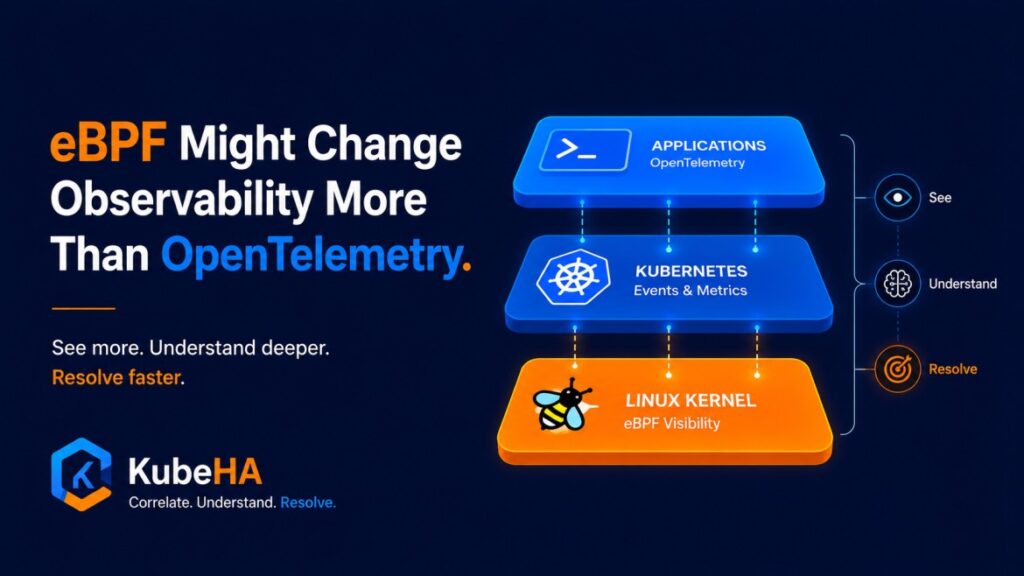
eBPF Might Change Observability More Than OpenTelemetry.
For the last few years, if you asked an SRE what the biggest change in observability was, the answer would almost certainly be:
OpenTelemetry.
And rightly so.
OpenTelemetry standardized how we collect:
Metrics
Logs
Traces
It solved one of the biggest problems in observability: fragmented instrumentation.
But while everyone was looking at OpenTelemetry, another technology quietly matured.
One that doesn’t require application instrumentation.
One that sees what applications cannot.
One that observes the operating system itself.
That technology is eBPF.
And I believe it may change observability even more than OpenTelemetry.
The Evolution of Observability
Observability has evolved through several generations.
Generation 1 — Infrastructure Monitoring
We monitored:
CPU
Memory
Disk
Network
Typical tools:
Nagios
Zabbix
Prometheus
Question answered:
Is the infrastructure healthy?
Generation 2 — Application Monitoring
Then came APM.
We started tracking:
Response times
Transactions
Exceptions
Question answered:
Is the application healthy?
Generation 3 — Distributed Tracing
Microservices changed everything.
A single request now touches:
Gateway
 ↓
Auth Service
 ↓
Payment Service
 ↓
Inventory Service
 ↓
Database
OpenTelemetry became the universal instrumentation layer.
Question answered:
Where did the request spend time?
Generation 4 — Kernel-Level Observability
This is where eBPF enters.
Instead of asking applications to report information…
eBPF observes what the Linux kernel already knows.
That is an enormous shift.
What Makes eBPF Different?
Traditional observability depends on instrumentation.
Developers add SDKs:
OpenTelemetry SDK
or
otel.Tracer(...)
The application emits telemetry.
If instrumentation is missing…
Visibility is missing.
eBPF works differently.
It attaches programs safely to kernel events.
It observes:
System calls
Network packets
TCP connections
Process scheduling
File access
DNS lookups
Socket activity
Kernel latency
Container behavior
Without changing application code.
Why This Matters for Kubernetes
Modern Kubernetes environments are extremely dynamic.
Pods:
start
stop
restart
migrate
scale
Networking is abstracted through:
CNI plugins
kube-proxy
Service Meshes
Ingress Controllers
Many production problems occur below the application.
Examples:
TCP retransmissions
DNS delays
Socket backlog
SYN drops
Packet loss
Kernel scheduling latency
Applications never see these directly.
The kernel does.
Example: The Mystery Latency Spike
Imagine users report:
Checkout API is slow.
Traditional workflow:
Open Grafana.
CPU looks normal.
Memory looks normal.
Application logs show:
Request timeout
Tempo traces show:
Payment service took longer.
Still no root cause.
Now imagine eBPF is collecting kernel events.
You immediately discover:
TCP retransmissions increased
↓
Packet drops on Node-7
↓
Network queue saturation
↓
Payment latency increased
↓
Checkout slowed
The root cause wasn’t inside the application.
It was inside the networking stack.
Without kernel visibility, you may never have found it.
eBPF Removes Blind Spots
Traditional observability can miss:
Uninstrumented services
Third-party binaries
Legacy applications
Network stack behavior
Kernel scheduling issues
DNS latency
Container runtime problems
eBPF sees all of them.
That’s why many engineers call it:
“Observability without instrumentation.”
Why OpenTelemetry and eBPF Are Not Competitors
One misconception is:
eBPF will replace OpenTelemetry.
It won’t.
They solve different problems.
OpenTelemetry explains:
Application behavior
Business transactions
Service dependencies
User requests
eBPF explains:
Kernel behavior
Networking
Scheduling
System calls
Container runtime
Resource contention
Think of them as complementary layers.
Business Request
        │
        ▼
OpenTelemetry
        │
Application
        │
        ▼
Linux Kernel
        │
        ▼
eBPF
Together they provide full-stack visibility.
The Future Is Correlation, Not Collection
Here’s where the industry is heading.
We’re no longer struggling to collect telemetry.
We have:
Metrics
Logs
Traces
Events
Profiling
eBPF signals
The real challenge is correlation.
Imagine this timeline:
10:02 Deployment Started
 ↓
10:03 eBPF detects TCP retransmissions
 ↓
10:04 DNS lookup latency increases
 ↓
10:05 OpenTelemetry traces show slower requests
 ↓
10:06 Error rate increases
 ↓
10:08 HPA scales pods
 ↓
10:10 Customer latency spikes
Every tool contributes part of the story.
None tells the whole story.
Where KubeHA Fits
This is exactly where KubeHA delivers value.
KubeHA isn’t another monitoring tool.
It is an investigation and correlation platform.
It brings together:
Kubernetes Events
Deployment history
Config changes
Prometheus metrics
Loki logs
Tempo/OpenTelemetry traces
eBPF kernel events
Node health
Control plane telemetry
Autoscaler activity
into a single timeline.
Instead of switching between five different tools, engineers see one investigation flow.
Example Investigation With KubeHA
Without KubeHA:
Grafana
 ↓
Prometheus
 ↓
Loki
 ↓
Tempo
 ↓
kubectl
 ↓
eBPF Dashboard
 ↓
ArgoCD
 ↓
Root Cause
With KubeHA:
10:02 Deployment Started
 ↓
10:03 TCP Retransmissions Increased (eBPF)
 ↓
10:04 DNS Latency Increased
 ↓
10:05 OpenTelemetry Trace Latency Increased
 ↓
10:06 Pods Restarted
 ↓
10:07 Error Rate Increased
 ↓
Root Cause Identified
Instead of hunting across tools, engineers focus on understanding and resolving the issue.
Why This Matters for AI-Driven Operations
AI is rapidly becoming part of incident response.
But AI is only as good as the context it receives.
If it sees only:
Metrics
Its conclusions are limited.
If it sees:
Metrics
Logs
Traces
Kubernetes events
Deployment history
eBPF kernel signals
Infrastructure topology
It can reason far more effectively.
The future of AIOps depends on high-quality, correlated telemetry.
eBPF adds an entirely new dimension to that context.
Challenges of Adopting eBPF
Like any powerful technology, eBPF isn’t free of challenges.
Teams should consider:
Learning Curve
Kernel concepts are unfamiliar to many application engineers.
Security
eBPF programs run in kernel space, requiring careful governance and permissions.
Data Volume
Kernel-level telemetry can generate massive amounts of data.
Without intelligent filtering and correlation, teams risk replacing one form of noise with another.
Correlation
Kernel events are valuable only when connected to:
Kubernetes resources
Application requests
Deployment history
Service dependencies
Raw kernel events alone don’t tell the complete story.
The Bigger Industry Shift
Over the next five years, I believe observability platforms will evolve from:
Instrumentation-first
to
Multi-layer correlation platforms
where:
OpenTelemetry explains applications.
eBPF explains infrastructure.
Kubernetes events explain orchestration.
AI explains relationships.
The winners won’t be the platforms collecting the most telemetry.
They’ll be the platforms helping engineers understand why incidents happen.
Final Thought
OpenTelemetry standardized observability.
eBPF expands observability into places we could never see before.
But neither technology, by itself, solves the biggest problem facing SREs today.
The real challenge is connecting signals into a coherent explanation.
Because during an outage, engineers don’t need another graph.
They need the story.
And the future of observability belongs to platforms that can tell it.
 To learn more about eBPF, Kubernetes observability, OpenTelemetry, incident correlation, and AI-powered SRE workflows, follow KubeHA (https://linkedin.com/showcase/kubeha-ara/).
Book a demo today at https://kubeha.com/schedule-a-meet/
Experience KubeHA today: www.KubeHA.com
KubeHA’s introduction, https://www.youtube.com/watch?v=PyzTQPLGaD0
#DevOps #sre #monitoring #observability #remediation #Automation #kubeha #IncidentResponse #AlertRecovery #prometheus #opentelemetry #grafana, #loki #tempo #trivy #slack #Efficiency #ITOps #SaaS #ContinuousImprovement #Kubernetes #TechInnovation #StreamlineOperations #ReducedDowntime #Reliability #ScriptingFreedom #MultiPlatform #SystemAvailability #srexperts23 #sredevops #DevOpsAutomation #EfficientOps #OptimizePerformance #Logs #Metrics #Traces #ZeroCode.