Author name: admin

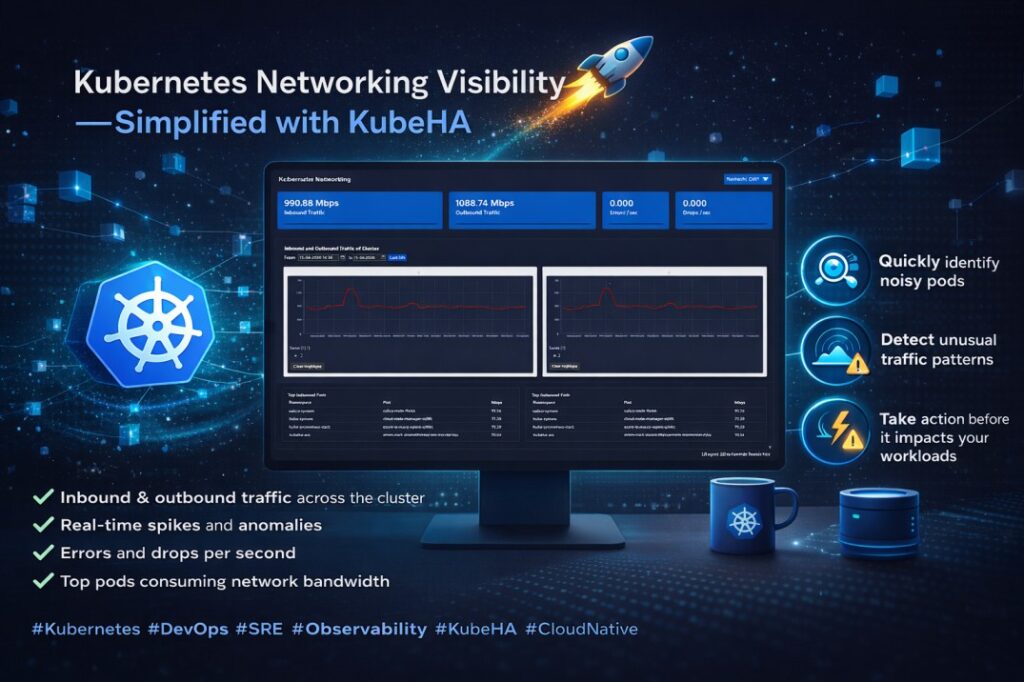
Kubernetes Networking Visibility – Simplified with KubeHA

Ever wondered where your cluster bandwidth is really going? With KubeHA’s Networking Dashboard, you get instant clarity on:✔️ Inbound & outbound traffic across the cluster✔️ Real-time spikes and anomalies✔️ Errors and drops per second✔️ Top pods consuming network bandwidth No more guesswork. No more digging through multiple tools. 👉 Quickly identify noisy pods👉 Detect unusual […]

Kubernetes Networking Visibility – Simplified with KubeHA Read More »

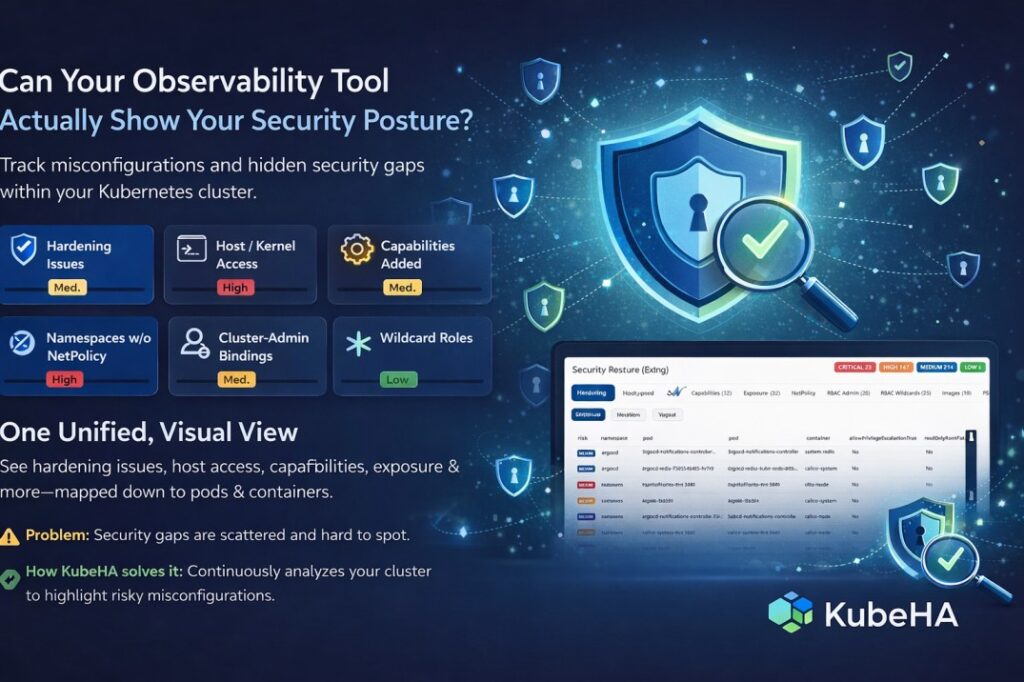
Can Your Observability Tool Actually Show Your Security Posture?

Most tools stop at metrics and logs. But real Kubernetes issues often come from misconfigurations and hidden security gaps. With KubeHA’s Security & Config page, you can easily track: Hardening Issues Host / Kernel Access Capabilities Added Public Exposure Namespaces without Network Policies Cluster-Admin Bindings Wildcard Roles Image Hygiene Instead of manually auditing YAMLs or

Can Your Observability Tool Actually Show Your Security Posture? Read More »

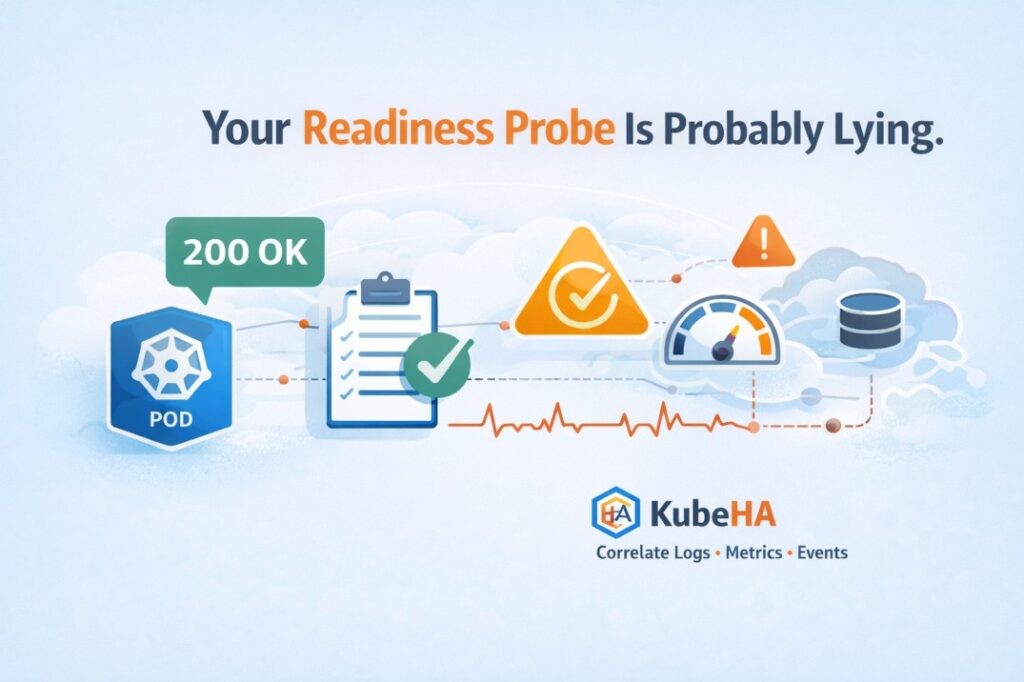
Your Readiness Probe Is Probably Lying.

Kubernetes readiness probes are supposed to answer one simple question: “Can this pod handle traffic?” In practice, they often answer a very different one: “Is this process responding to HTTP?” And that difference causes real production incidents. What Readiness Probes Actually Do A typical readiness probe looks like this: readinessProbe:   httpGet:     path: /health

Your Readiness Probe Is Probably Lying. Read More »

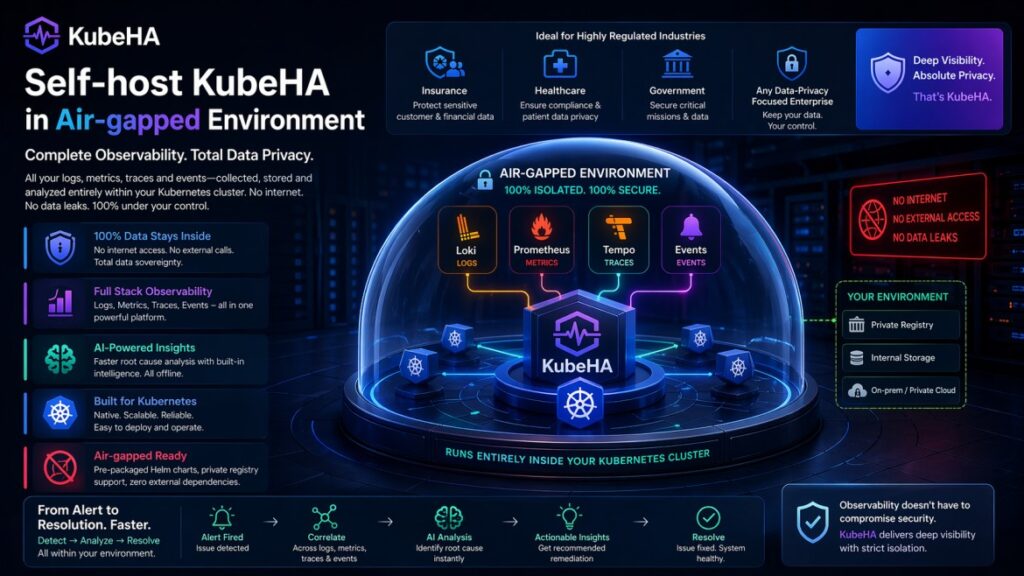
Deploy KubeHA your way – without compromises

Every organization has different needs when it comes to security, control, and speed. That’s why KubeHA offers flexible deployment models tailored to your environment: Air-Gapped – Maximum security, zero internet dependency Private Instance – Full control within your VPC SaaS (KubeHA Cloud) – Fully managed, fast & hassle-free Whether you’re a regulated enterprise or a

Deploy KubeHA your way – without compromises Read More »

🚨 Same Deployment. Same Code. Different Behavior. Why?

You deploy the exact same application to two Kubernetes clusters. Same YAML Same image Same configs But suddenly… One cluster shows latency spikes Another throws intermittent errors Metrics don’t align Debugging turns into a guessing game Sound familiar? The Reality Most teams assume: “If configs are same, behavior should be same.” But in Kubernetes, hidden

🚨 Same Deployment. Same Code. Different Behavior. Why? Read More »

Microservices + Kubernetes = Debugging Nightmare (If Done Wrong)

Microservices promised scalability, flexibility, and independent deployments. Kubernetes made it possible to run them at scale. But together, they introduced a new problem: Debugging distributed systems is exponentially harder than building them. Why Debugging Becomes a Nightmare In a monolith: • one codebase• one runtime• one log stream• one failure domain In microservices on Kubernetes:

Microservices + Kubernetes = Debugging Nightmare (If Done Wrong) Read More »

🚀 Stop Guessing. Start Seeing. – Service Graph in KubeHA

Most teams debug Kubernetes issues by jumping between logs, metrics, and traces…and still miss the real root cause. 👉 With KubeHA Service Graph, you get a clear, real-time map of service-to-service interactions – instantly. 🔍 See: Who is calling whom Request rates (RPS) Error rates Latency between services ⚡ Identify bottlenecks, failures, and anomalies in

🚀 Stop Guessing. Start Seeing. – Service Graph in KubeHA Read More »

Your Kubernetes Skills Don’t Matter If You Can’t Debug Under Pressure.

You can write perfect YAML.You know Helm, HPA, networking, storage. But during an incident? That knowledge is rarely the problem. Reality of Production Incidents In real outages, you don’t get time to think slowly. You face: • incomplete data• noisy alerts• multiple failing components• pressure from stakeholders The challenge is not what you know. It’s

Your Kubernetes Skills Don’t Matter If You Can’t Debug Under Pressure. Read More »

DevOps Isn’t About Automation. It’s About Reducing Unknowns.

Automation is often seen as the ultimate goal in DevOps. CI/CD pipelines.Auto-scaling.Auto-remediation.Self-healing systems. But here’s the uncomfortable truth: Automation without understanding simply accelerates failure. The Real Problem: Unknowns in Distributed Systems Modern Kubernetes environments are inherently complex. Every system consists of: • multiple microservices• asynchronous communication• dynamic scaling• ephemeral infrastructure• constantly changing configurations Failures rarely

DevOps Isn’t About Automation. It’s About Reducing Unknowns. Read More »

Your Kubernetes Cluster Probably Has 30% Idle Resources

Most Kubernetes clusters look healthy on the surface. Pods are running. Nodes are not overloaded. Autoscaling works. Applications are stable. But underneath this apparent stability, many clusters are quietly wasting 30–50% of their compute capacity. This inefficiency usually comes from resource configuration drift over time, especially around CPU and memory requests and limits. And because

Your Kubernetes Cluster Probably Has 30% Idle Resources Read More »

Scroll to Top