Ever wondered where your cluster bandwidth is really going?
With KubeHA’s Networking Dashboard, you get instant clarity on:
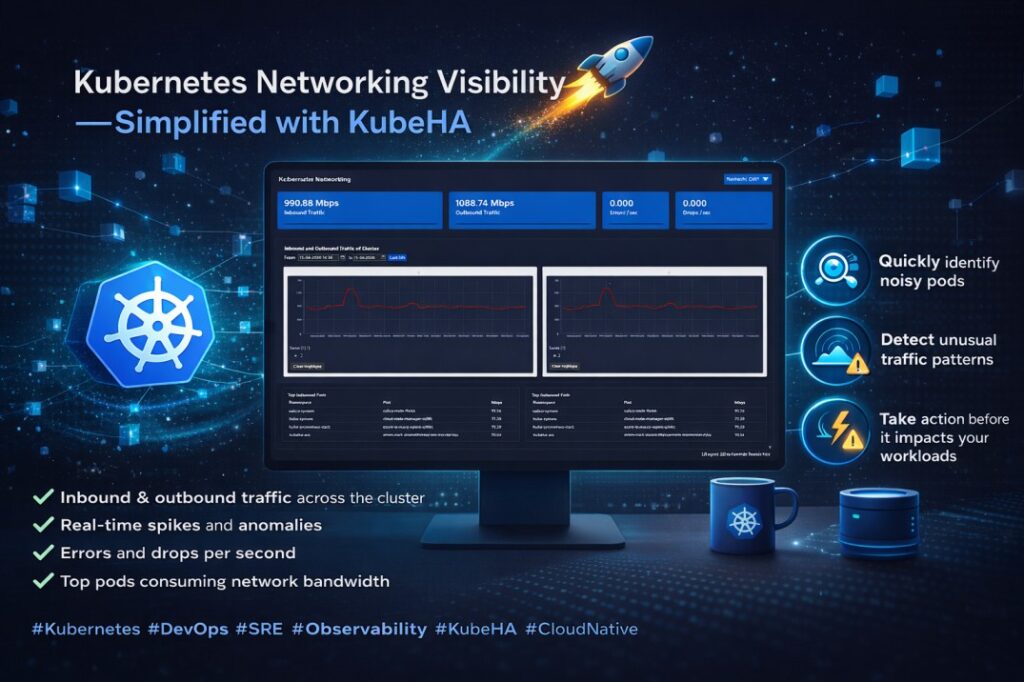
✔️ Inbound & outbound traffic across the cluster
✔️ Real-time spikes and anomalies
✔️ Errors and drops per second
✔️ Top pods consuming network bandwidth
No more guesswork. No more digging through multiple tools.
👉 Quickly identify noisy pods
👉 Detect unusual traffic patterns
👉 Take action before it impacts your workloads
All in one place. Clean. Actionable. Real-time.
Because observability should lead to answers – not more dashboards.
Follow KubeHA (https://linkedin.com/showcase/kubeha-ara/).
Book a demo today at https://kubeha.com/schedule-a-meet/
Experience KubeHA today: www.KubeHA.com
KubeHA’s introduction, https://www.youtube.com/watch?v=PyzTQPLGaD0
#DevOps #sre #monitoring #observability #remediation #Automation #kubeha #IncidentResponse #AlertRecovery #prometheus #opentelemetry #grafana, #loki #tempo #trivy #slack #Efficiency #ITOps #SaaS #ContinuousImprovement #Kubernetes #TechInnovation #StreamlineOperations #ReducedDowntime #Reliability #ScriptingFreedom #MultiPlatform #SystemAvailability #srexperts23 #sredevops #DevOpsAutomation #EfficientOps #OptimizePerformance #Logs #Metrics #Traces #ZeroCode