Most teams debug Kubernetes issues by jumping between logs, metrics, and traces…
and still miss the real root cause.
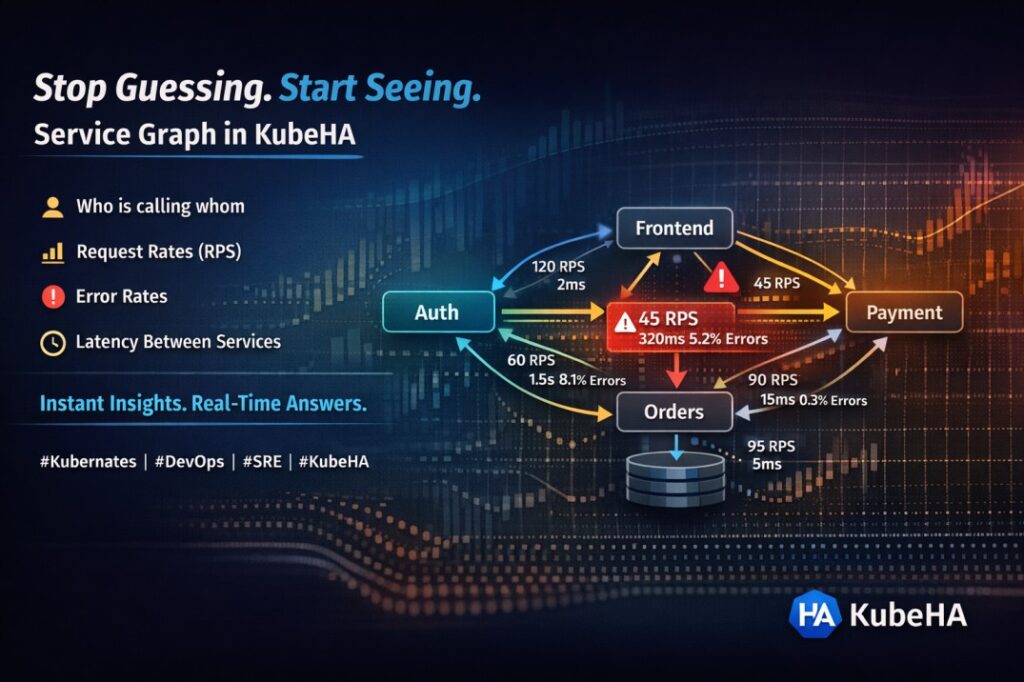
👉 With KubeHA Service Graph, you get a clear, real-time map of service-to-service interactions – instantly.
🔍 See:
- Who is calling whom
- Request rates (RPS)
- Error rates
- Latency between services
⚡ Identify bottlenecks, failures, and anomalies in seconds, not hours
No more blind debugging.
No more tool switching.
Just one unified view of your entire system.
💡 Built for DevOps & SRE teams who need answers fast
👉 To learn more about Kubernetes observability and service graphs, follow KubeHA(https://linkedin.com/showcase/kubeha-ara/)
Book a demo today at https://kubeha.com/schedule-a-meet/
Experience KubeHA today: www.KubeHA.com
KubeHA’s introduction, https://www.youtube.com/watch?v=PyzTQPLGaD0
#DevOps #sre #monitoring #observability #remediation #Automation #kubeha #IncidentResponse #AlertRecovery #prometheus #opentelemetry #grafana, #loki #tempo #trivy #slack #Efficiency #ITOps #SaaS #ContinuousImprovement #Kubernetes #TechInnovation #StreamlineOperations #ReducedDowntime #Reliability #ScriptingFreedom #MultiPlatform #SystemAvailability #srexperts23 #sredevops #DevOpsAutomation #EfficientOps #OptimizePerformance #Logs #Metrics #Traces #ZeroCode