Logs are one of the first things engineers look at during an incident.
And for a long time, they were enough.
But modern distributed systems have changed the game.
Today, relying on logs alone for debugging is not just insufficient – it can actively mislead root cause analysis.
The Problem With Log-Centric Debugging
Logs tell you what happened inside a component.
They rarely tell you:
• what triggered the failure
• what changed before the issue
• how other services behaved
• whether infrastructure contributed
• how the issue propagated across the system
In a monolith, logs were enough.
In Kubernetes-based microservices architectures, failures are multi-dimensional.
A single request may involve:
multiple services
• network hops
• retries
• circuit breakers
• asynchronous queues
• external dependencies
Logs from one service show only a fragment of the system behaviour.
Example: Why Logs Mislead in Real Incidents
Consider a latency spike in a checkout service.
Application logs might show:
Timeout calling payment-service
From logs alone, it appears:
→ payment-service is slow
But the real root cause could be:
• DNS latency causing connection delays
• Node-level CPU throttling
• Recent deployment affecting connection pooling
• Upstream retry storms
• Network congestion
• External dependency degradation
Logs capture symptoms, not always the origin of failure.
The Hidden Complexity of Distributed Failures
In Kubernetes environments, failures often involve interactions across layers:
Layer | Example Failure |
Application | exception, timeout |
Container | OOMKilled, restart |
Node | CPU throttling, memory pressure |
Network | packet drops, DNS latency |
Cluster | scheduling delays |
Deployment | configuration change |
Logs typically exist at the application layer.
But incidents are rarely isolated to a single layer.
This creates a critical gap in debugging.
Why Logs Create Debugging Blind Spots
1. Lack of Temporal Context
Logs show events, but not always:
• what happened immediately before
• what changed in the cluster
• whether behavior shifted after a deployment
Without a timeline, correlation becomes guesswork.
2. Lack of Cross-Service Visibility
Each service logs independently.
There is no inherent connection between:
• upstream request
• downstream dependency
• retry behavior
• cascading failures
Tracing tries to solve this, but many teams don’t fully implement it.
3. Volume and Noise
In high-scale systems:
• logs are massive
• signal-to-noise ratio is low
• relevant patterns are hard to detect
Engineers often search logs with assumptions, which introduces bias into debugging.
4. Missing Infrastructure Signals
Logs usually don’t capture:
• Kubernetes events
• node pressure conditions
• scheduling failures
• autoscaler activity
These signals are often critical during incidents.
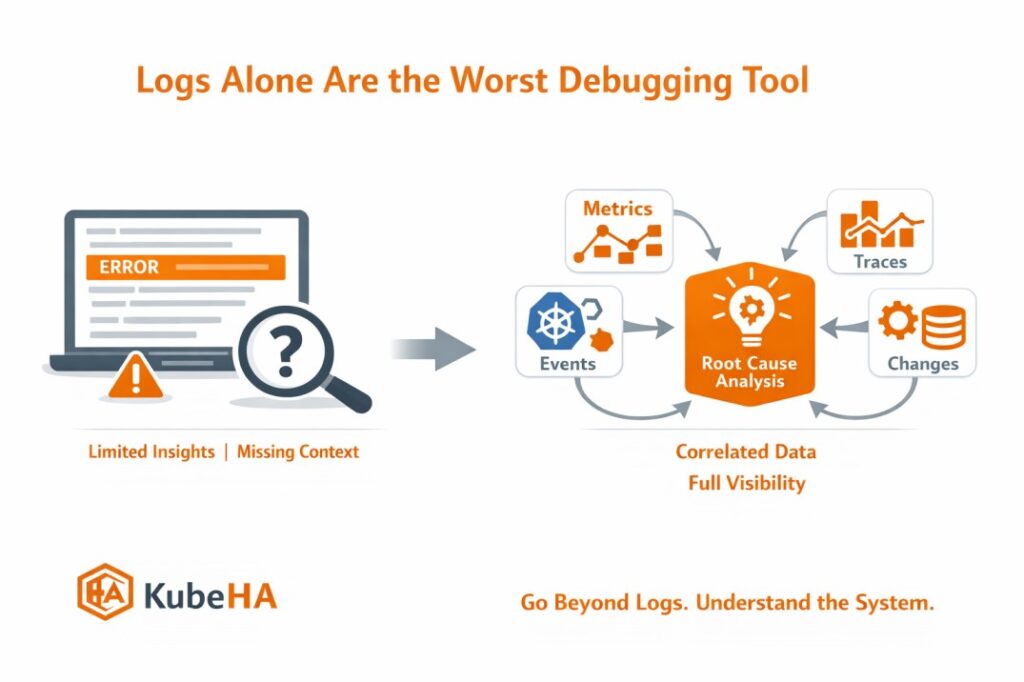
What Modern Debugging Actually Requires
Effective debugging in Kubernetes requires correlating multiple signals:
• logs → application behavior
• metrics → system trends
• traces → request flow
• events → cluster activity
• deployments → change history
This combination provides:
→ context
→ causality
→ propagation path
Without correlation, engineers are forced to manually piece together the story.
How KubeHA Helps
KubeHA bridges this gap by correlating signals across the cluster automatically.
Instead of relying on logs alone, it brings together:
• logs
• metrics
• Kubernetes events
• deployment changes
• pod restart patterns
• dependency interactions
This enables insights such as:
“Latency increased after deployment v4.1. Retry rate increased 2.5x. DNS latency spiked on node-3. Payment-service response time degraded.”
This kind of correlation provides:
• full incident timeline
• root cause visibility
• dependency impact analysis
• faster mean time to resolution (MTTR)
Instead of asking:
“What do the logs say?”
SRE teams can ask:
“What actually happened across the system?”
Real-World Impact
Teams that move beyond log-only debugging typically see:
• faster incident resolution
• reduced debugging effort
• better understanding of failure patterns
• improved system reliability
Because modern outages are not single-service failures.
They are system-level events.
Final Thought
Logs are still important.
But they are only one piece of the puzzle.
In distributed systems, debugging is not about reading logs.
It is about understanding how the system behaved as a whole.
The sooner teams move from log-centric debugging to correlation-driven debugging, the faster they can identify and resolve issues.
👉 To learn more about Kubernetes debugging, observability correlation, and production incident analysis, follow KubeHA (https://linkedin.com/showcase/kubeha-ara/).
Book a demo today at https://kubeha.com/schedule-a-meet/
Experience KubeHA today: www.KubeHA.com
KubeHA’s introduction, https://www.youtube.com/watch?v=PyzTQPLGaD0
#DevOps #sre #monitoring #observability #remediation #Automation #kubeha #IncidentResponse #AlertRecovery #prometheus #opentelemetry #grafana, #loki #tempo #trivy #slack #Efficiency #ITOps #SaaS #ContinuousImprovement #Kubernetes #TechInnovation #StreamlineOperations #ReducedDowntime #Reliability #ScriptingFreedom #MultiPlatform #SystemAvailability #srexperts23 #sredevops #DevOpsAutomation #EfficientOps #OptimizePerformance #Logs #Metrics #Traces #ZeroCode