Real-Time Alert Correlation: From Chaos to Root Cause
 Ever faced an alert storm at 2 AM?
One pod crashes, and suddenly:
- Readiness probe fails
- Service goes unreachable
- Latency spikes in downstream APIs
- Error rates shoot up in Grafana
You’re buried in 50 alerts… but only one root cause exists.
This is where Real-Time Alert Correlation changes the game.
1. The Problem: Alert Noise
- Prometheus floods with CPU/memory spikes.
- Loki logs show “OOMKilled.”
- Tempo traces highlight downstream failures.
- PagerDuty wakes you up for every single symptom.
Without correlation, you’re stuck manually stitching signals together.
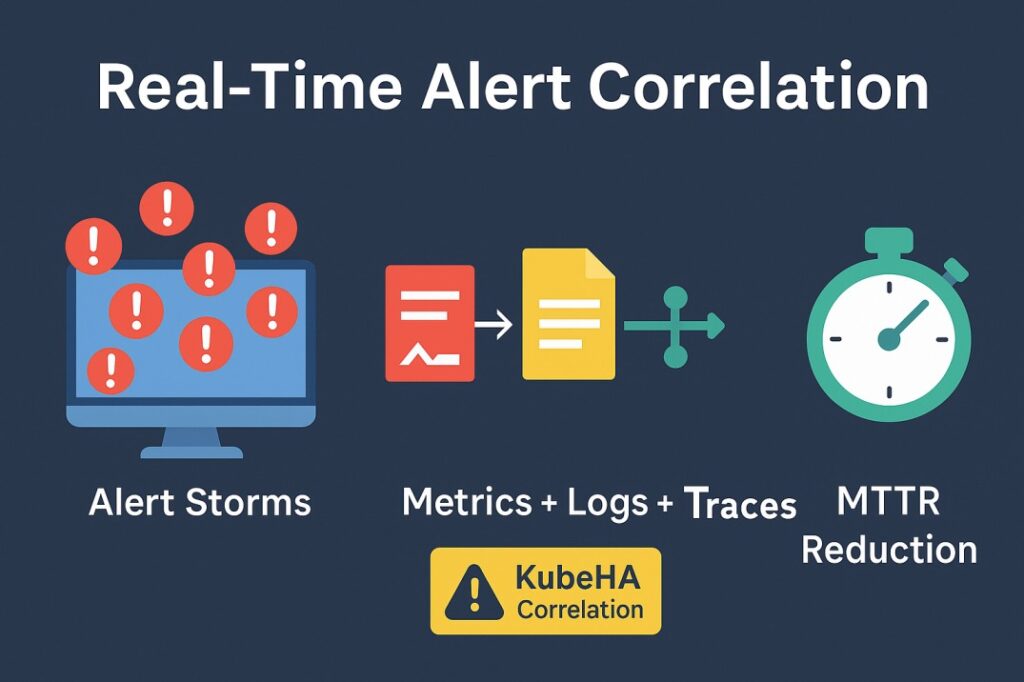
2. Real-Time Correlation with Metrics + Logs + Traces
- Metrics (Prometheus): show what broke.
- Logs (Loki/Fluentd): explain why it broke.
- Traces (Tempo/OpenTelemetry): pinpoint where it broke.
By linking these signals in real time, engineers see the entire incident chain instead of chasing isolated alerts.
3. KubeHA’s Role: Automated RCA
KubeHA applies AI-driven correlation to Kubernetes incidents:
- Groups related alerts into a single incident thread.
- Maps alerts to specific Kubernetes resources (pods, deployments, namespaces).
- Surfaces the root cause (e.g., “frontend-service OOMKilled”) instead of noise.
- Suggests remediation commands (e.g., kubectl describe pod, kubectl get events).
 Instead of 30 alerts, engineers see one actionable root cause.
4. Technical Workflow Example
- Prometheus: High error-rate alert triggered.
- Loki: Pod logs show OOMKilled.
- Tempo: Trace highlights downstream failure in checkout-service.
- KubeHA Correlation: Groups all signals → Root Cause: frontend-service pod OOMKilled.
MTTR reduced by 70%, engineers work smarter, not harder.
5. Why It Matters
- Less alert fatigue for on-call SREs.
- Faster incident response, fewer SLA breaches.
- Confidence under pressure — know what’s noise vs what’s real.
 Follow KubeHA(https://lnkd.in/gV4Q2d4m) to learn how to implement real-time alert correlation and cut through noise with automated RCA for Kubernetes clusters.
Experience KubeHA today: www.KubeHA.com
KubeHA’s introduction,
https://lnkd.in/gjK5QD3i