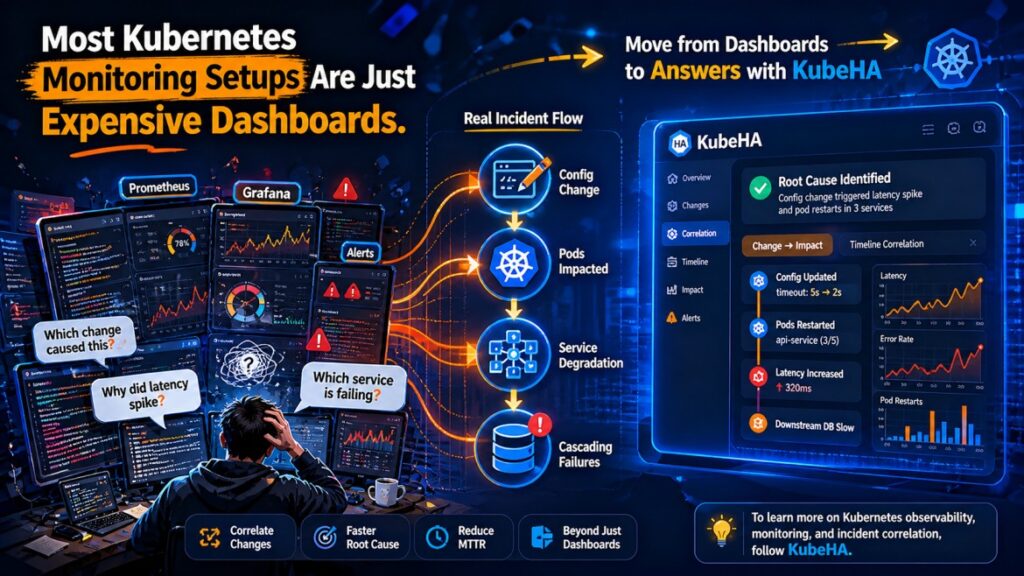
Most teams believe they have observability because they have dashboards.
Grafana panels.
Prometheus metrics.
Alerting rules.
Everything looks “covered.”
But during a real production incident, something becomes obvious:
Dashboards show data. They don’t explain systems.
The Illusion of Monitoring
Typical Kubernetes monitoring setups provide:
• CPU and memory graphs
• request rate and error rate
• latency percentiles
• pod and node metrics
These are useful.
But they answer only one type of question:
“What is happening right now?”
They do not answer:
• What changed before this?
• Why did this start happening?
• Which component triggered this?
• How is the issue propagating?
Real Incident Scenario
Symptom:
• latency spike in API
Dashboard shows:
• CPU stable
• memory stable
• request rate increased
• latency increased
Engineer reaction:
→ scale pods
→ check logs
→ investigate service
Actual root cause:
• recent deployment changed retry logic
• downstream dependency slowed
• retries amplified load
• cascading latency increase
The dashboard didn’t show the cause.
It only showed the effect.
Why Dashboards Fail During Incidents
1. No Change Context
Dashboards rarely include:
• deployment changes
• config updates
• rollout timelines
Yet most incidents are triggered by changes.
2. No Cross-Signal Correlation
Metrics exist separately from:
• logs
• traces
• Kubernetes events
Engineers must manually correlate them.
3. Static Visualization of Dynamic Systems
Dashboards show snapshots or time-series.
But distributed systems require:
• causal relationships
• event timelines
• dependency mapping
4. Alert Without Explanation
Typical alerts:
High latency detected
But no insight into:
• why latency increased
• which service caused it
• what changed before it
The Real Cost of “Expensive Dashboards”
Monitoring tools are not cheap.
But the real cost is:
• longer MTTR
• incorrect debugging paths
• unnecessary scaling
• repeated incidents
Because teams spend time:
❌ interpreting graphs
❌ switching between tools
❌ guessing relationships
Instead of understanding the system.
What Modern Observability Requires
To debug Kubernetes systems effectively, teams need:
🔗 Correlation Across Signals
• metrics → behavior
• logs → events
• traces → flow
• Kubernetes events → changes
⏱️ Timeline Awareness
Understanding:
• what changed
• when it changed
• what happened after
🧠 Dependency Context
Mapping:
• service interactions
• upstream/downstream impact
• cascading failures
🔍 Root Cause Identification
Moving from:
❌ “What is wrong?”
to:
✅ “Why did this happen?”
How KubeHA Helps
KubeHA transforms monitoring from dashboards into actionable operational intelligence.
🔗 Unified Correlation
KubeHA connects:
• metrics
• logs
• Kubernetes events
• deployment changes
• pod behavior
into a single investigation flow.
⏱️ Change-to-Impact Insights
Example:
“Latency increased after deployment v2.6. Retry rate increased. Downstream service latency degraded.”
🧠 Root Cause Visibility
Instead of:
❌ “High latency graph”
You get:
✅ “Latency caused by dependency slowdown triggered by config change.”
⚡ Faster Incident Response
KubeHA reduces:
• tool switching
• manual correlation
• guesswork
Helping SREs reach the root cause faster.
Real Outcome for Teams
Teams that move beyond dashboard-only monitoring see:
• reduced MTTR
• improved reliability
• fewer false escalations
• better system understanding
Final Thought
Dashboards are useful.
But they are only the starting point.
Monitoring shows you the problem.
Correlation helps you solve it.
Without correlation, dashboards become:
expensive visualizations of confusion.
👉 To learn more about Kubernetes observability, monitoring vs correlation, and production incident debugging, follow KubeHA (https://linkedin.com/showcase/kubeha-ara/).
Book a demo today at https://kubeha.com/schedule-a-meet/
Experience KubeHA today: www.KubeHA.com
KubeHA’s introduction, https://www.youtube.com/watch?v=PyzTQPLGaD0
#DevOps #sre #monitoring #observability #remediation #Automation #kubeha #IncidentResponse #AlertRecovery #prometheus #opentelemetry #grafana, #loki #tempo #trivy #slack #Efficiency #ITOps #SaaS #ContinuousImprovement #Kubernetes #TechInnovation #StreamlineOperations #ReducedDowntime #Reliability #ScriptingFreedom #MultiPlatform #SystemAvailability #srexperts23 #sredevops #DevOpsAutomation #EfficientOps #OptimizePerformance #Logs #Metrics #Traces #ZeroCode