This one surprises many teams.
You open your dashboard:
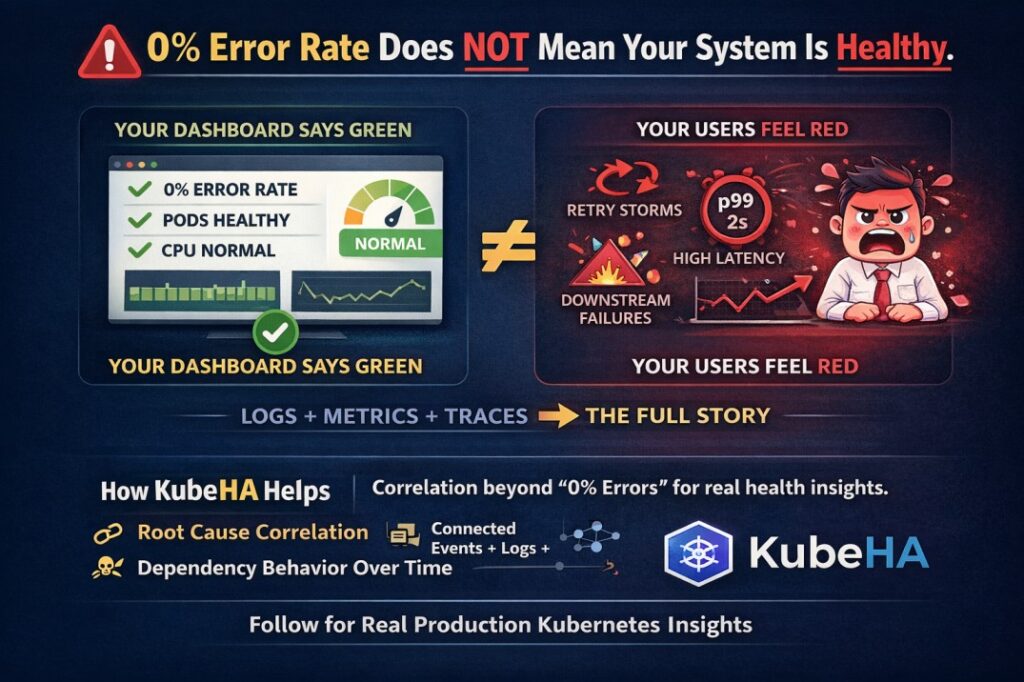
✅ Error rate: 0%
✅ Pods running
✅ CPU normal
But users are complaining.
Why?
Because modern systems hide failure in subtle ways:
• Retries mask errors
• Circuit breakers absorb failures
• Timeouts escalate silently
• Tail latency (p95 / p99) explodes
• Downstream dependencies degrade slowly
• Traffic volume drops silently
Your system may look green.
Your users feel red.
⚠️ The Real Problem
Most monitoring tools stop at:
“Error rate is fine.”
But health is more than errors.
Healthy systems are:
- Predictable
- Stable under load
- Consistent in latency
- Free from retry storms
- Transparent in dependency behavior
0% error rate can still mean:
🔴 Retry storm building
🔴 Latency degradation
🔴 Silent dependency slowdown
🔴 Artificially hidden failures
🔎 This Is Where Correlation Matters
Instead of only watching:
- Error %
- CPU
- Memory
You must observe:
• Retry rate trend
• Tail latency (p95, p99)
• Sudden traffic drops
• Spike in container restarts
• External service call duration
• Dependency mapping changes
Most teams can see metrics.
Very few can correlate them.
🚀 How KubeHA Helps Here
KubeHA doesn’t stop at showing metrics.
It correlates:
🔗 Logs + Metrics + Events + Traces
🔗 Restart patterns + deployment changes
🔗 Traffic shifts + latency anomalies
🔗 Dependency behavior over time
Instead of asking:
“Why are users slow?”
You get:
“Latency increased 5 mins after new deployment. Retry rate increased 3x. External payment service latency spiked.”
No guessing.
No dashboard hopping.
No manual stitching.
Just faster root cause.
Healthy infrastructure isn’t about no errors.
It’s about early detection of invisible instability.
So here’s the real question:
Are you monitoring dashboards –
or are you understanding your system behavior?
👉 To learn more about hidden Kubernetes failure patterns and real production observability, follow KubeHA (https://linkedin.com/showcase/kubeha-ara/).
Book a demo today at https://kubeha.com/schedule-a-meet/
Experience KubeHA today: www.KubeHA.com
KubeHA’s introduction, https://www.youtube.com/watch?v=PyzTQPLGaD0
#DevOps #sre #monitoring #observability #remediation #Automation #kubeha #IncidentResponse #AlertRecovery #prometheus #opentelemetry #grafana, #loki #tempo #trivy #slack #Efficiency #ITOps #SaaS #ContinuousImprovement #Kubernetes #TechInnovation #StreamlineOperations #ReducedDowntime #Reliability #ScriptingFreedom #MultiPlatform #SystemAvailability #srexperts23 #sredevops #DevOpsAutomation #EfficientOps #OptimizePerformance #Logs #Metrics #Traces #ZeroCode