Automate Alert Remediation Before Your Coffee Gets Cold
 Why should SREs wake up to fix something the cluster could have fixed itself?
In Kubernetes, alerts are inevitable: pods OOMKilled, nodes NotReady, CrashLoopBackOff, failing probes. Traditional observability stacks (Prometheus + Grafana + Alertmanager) detect these failures, but remediation still relies on engineers.
That means lost sleep, wasted time, and longer MTTR.
The solution: Automated Alert Remediation.
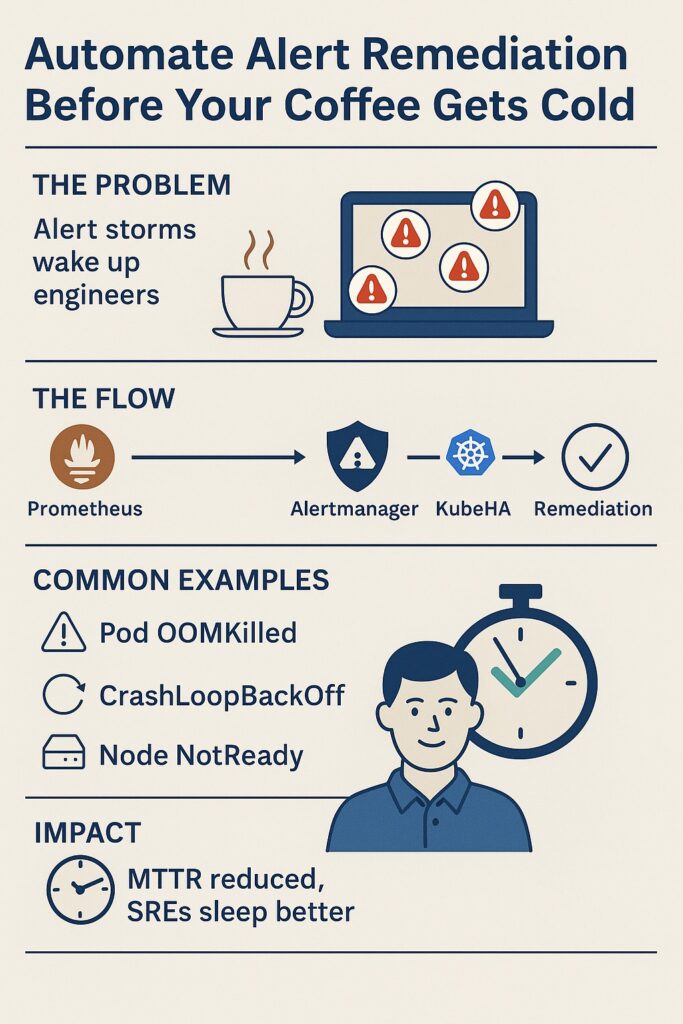
1. The Problem: Alert Storms = Engineer Fatigue
- One pod crash → 30 downstream alerts (latency, errors, service unavailability).
- Manual checks: kubectl logs, kubectl get events, restarts.
- MTTR grows, SLAs break, on-call engineers burn out.
 Customers don’t care about alerts. They care about uptime.
2. The Automation Flow: From Alert → Root Cause → Fix
Step 1: Detect the Failure with Prometheus
– alert: PodOOMKilled
expr: kube_pod_container_status_last_terminated_reason{reason=”OOMKilled”} > 0
for: 1m
labels:
severity: critical
annotations:
summary: “Pod {{ $labels.pod }} OOMKilled in ns {{ $labels.namespace }}”
Step 2: Alertmanager Webhook → KubeHA
- Alert is sent to KubeHA (or automation system).
Step 3: KubeHA Correlates Alerts
- Pulls metrics (Prometheus), logs (Loki), traces (Tempo), events (kubectl get events).
- Identifies the root cause: e.g., frontend-service memory leak.
Step 4: Automated Remediation Triggered
kubectl rollout restart deployment frontend-service -n production
- Optionally: adjust HPA/VPA, drain node, or evict pods.
3. Common Auto-Remediation Scenarios
- OOMKilled pod → Restart pod / tune memory.
- CrashLoopBackOff → Rollout restart / rollback.
- Node NotReady → Drain + reschedule pods.
- Disk Pressure → Evict pods + clean space.
- High Latency → Auto-scale replicas via HPA.
4. Guardrails to Stay Safe
- Dry-run mode for new rules.
- Rate limits (max 3 restarts/hour).
- Audit logs of all automated actions.
- Approval workflows for destructive fixes (kubectl delete).
5. Real-World Example
 frontend-service OOMKilled → 40 alerts triggered.
- Before Automation: PagerDuty woke SRE, 20 minutes to debug + restart.
- With KubeHA: Pod restarted in <2 minutes, correlated alerts closed, customers never noticed.
 Bottom line: Automated remediation isn’t about replacing SREs — it’s about removing toil. By combining Prometheus + Alertmanager + KubeHA, you turn alert storms into self-healing clusters.
Follow KubeHA(https://lnkd.in/gV4Q2d4m) for ready-to-use YAMLs, remediation playbooks, and automation blueprints to cut MTTR by 70%+.
Experience KubeHA today: www.KubeHA.com
KubeHA’s introduction, https://lnkd.in/gjK5QD3i(https://lnkd.in/gV4Q2d4m)