CrashLoopBackOff Is Not the Root Cause. It’s a Signal.
Many engineers see this and panic:
CrashLoopBackOff
They immediately start checking:
- Pod logs
- Application errors
- Container startup scripts
But here’s the reality most people miss:
CrashLoopBackOff is not the problem.
It’s Kubernetes telling you something deeper is wrong.
What CrashLoopBackOff Actually Means
When a container repeatedly crashes, Kubernetes applies an exponential backoff restart policy.
Typical restart intervals look like this:
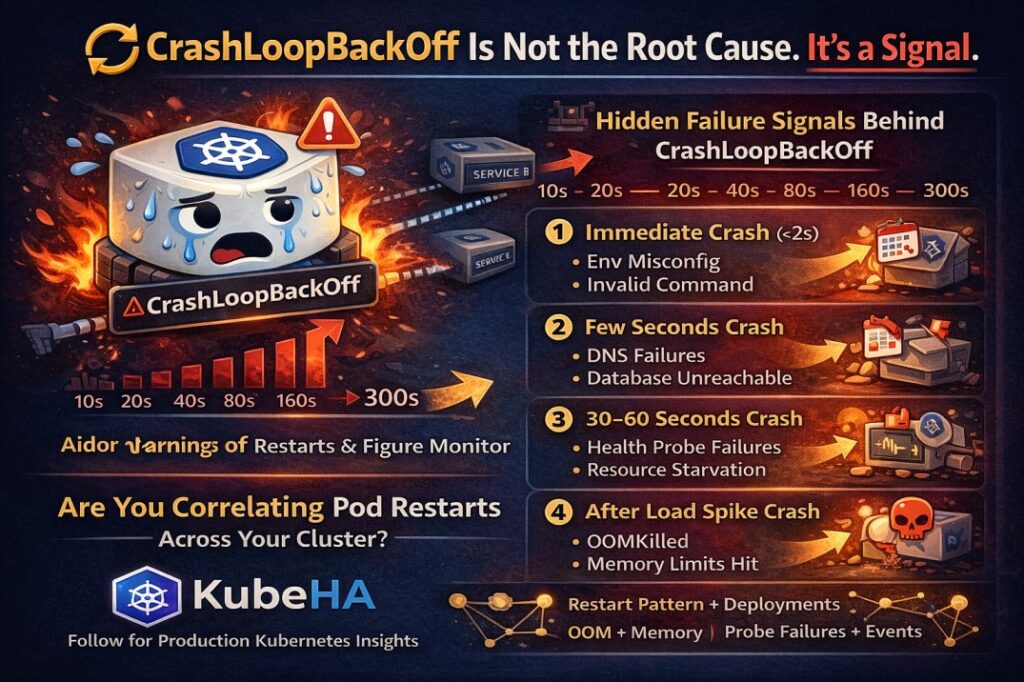
10s → 20s → 40s → 80s → 160s → 300s (max)
This is Kubernetes protecting the cluster from rapid restart storms.
But the pattern of restarts reveals important signals.
The Hidden Signals Behind CrashLoopBackOff
Different restart patterns usually point to different root causes.
1️⃣ Immediate Crash (<2 seconds)
Likely causes:
- Missing environment variables
- Invalid container command
- Binary startup failure
- Configuration errors
2️⃣ Crash After Few Seconds
Usually indicates:
- Dependency connection failures
- Database not reachable
- DNS resolution issues
- Service endpoints unavailable
3️⃣ Crash After 30–60 Seconds
Often related to:
- Liveness probe misconfiguration
- Application health endpoint failures
- Resource starvation
- Initialization timing issues
4️⃣ Crash After Load Spike
This usually means:
- Memory limits exceeded
- OOMKilled containers
- Thread pool exhaustion
- Connection pool limits
What Advanced SRE Teams Actually Monitor
Instead of just looking at pod status, production SRE teams analyze:
- Restart frequency trends
- OOMKill events
- Probe failures
- Deployment changes before restarts
- Dependency latency spikes
- Node resource pressure
Because most restart storms are symptoms of deeper infrastructure issues.
Why CrashLoopBackOff Is Often Misdiagnosed
The biggest issue during incidents is context switching.
Engineers jump between:
- kubectl logs
- kubectl describe
- Prometheus dashboards
- Events
- Deployment history
Trying to stitch together the timeline manually.
This slows down root cause analysis.
How KubeHA Helps
KubeHA correlates signals across the cluster automatically.
Instead of manually investigating multiple tools, KubeHA correlates:
- Pod restart patterns
- Deployment changes
- Kubernetes events
- Logs and metrics
- Dependency behavior
So instead of asking:
“Why are these pods restarting?”
You get insights like:
“CrashLoopBackOff started 3 minutes after deployment v3.2.
Liveness probe failures increased.
Container memory usage exceeded limits.”
This drastically reduces the time needed for root cause identification.
Final Thought
CrashLoopBackOff is not Kubernetes failing.
It’s Kubernetes telling you:
“Something deeper in the system needs attention.”
The real skill in Kubernetes operations is not just fixing crashes.
It’s understanding the signals behind them.
 To learn more about Kubernetes failure signals, pod restart patterns, and production incident investigation, follow KubeHA(https://linkedin.com/showcase/kubeha-ara/).
Book a demo today at https://lnkd.in/dytfT3kk
Experience KubeHA today: www.KubeHA.com
KubeHA’s introduction, https://lnkd.in/gjK5QD3i
#DevOps #sre #monitoring #observability #remediation #Automation #kubeha #IncidentResponse #AlertRecovery #prometheus #opentelemetry #grafana, #loki #tempo #trivy #slack #Efficiency #ITOps #SaaS #ContinuousImprovement #Kubernetes #TechInnovation #StreamlineOperations #ReducedDowntime #Reliability #ScriptingFreedom #MultiPlatform #SystemAvailability #srexperts23 #sredevops #DevOpsAutomation #EfficientOps #OptimizePerformance #Logs #Metrics #Traces #ZeroCode