Modern systems generate massive amounts of data.
Logs.
Metrics.
Traces.
Events.
On paper, this looks like full observability.
In reality:
More data ≠ more understanding.
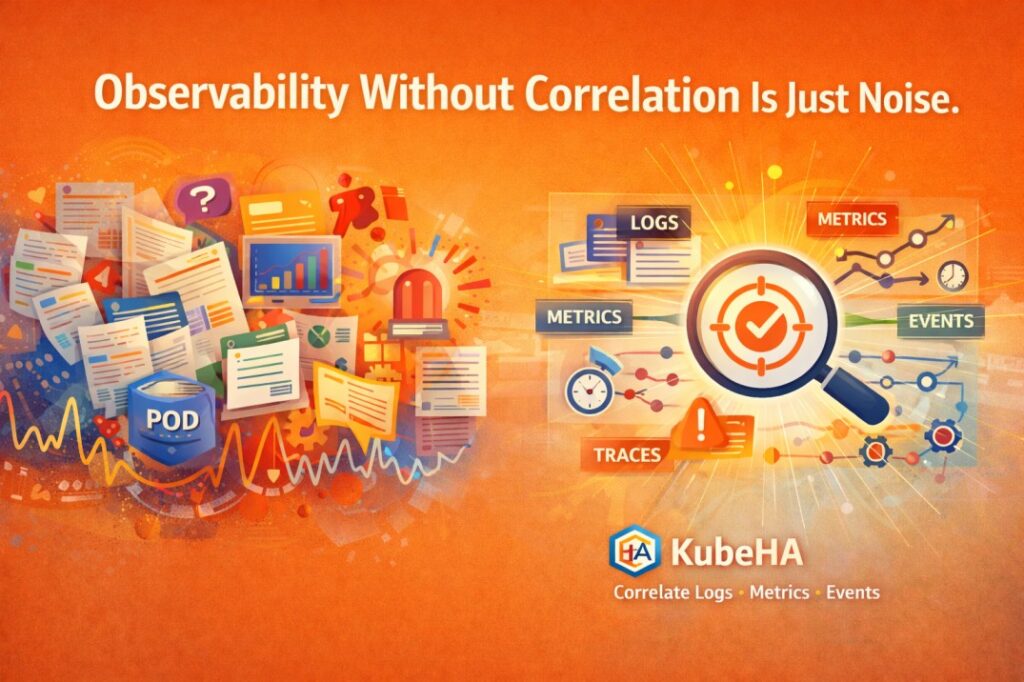
Without correlation, observability becomes overwhelming noise.
The Illusion of Observability
Most teams invest heavily in:
• Prometheus (metrics)
• Loki / ELK (logs)
• Tempo / Jaeger (traces)
• Kubernetes events
Each tool works well individually.
But during incidents, engineers face a critical problem:
Too many signals. No unified context.
What Happens During a Real Incident
Let’s say latency spikes in a service.
You open:
Metrics Dashboard
• CPU stable
• memory stable
• latency increased
Logs
Timeout calling downstream-service
Traces
• longer spans
• retries observed
Kubernetes Events
• pod restarted
• deployment rolled out
All signals are present.
But the real question remains unanswered:
How are these events connected?
The Core Problem: Lack of Correlation
Each signal answers a different question:
Signal | Answers |
Logs | what happened |
Metrics | how system behaved |
Traces | where it propagated |
Events | what changed |
But incidents require answering:
Why did this happen?
Without correlation, engineers must manually:
• jump between tools
• align timestamps
• guess relationships
• build mental models
This slows down debugging and introduces errors.
Why Noise Increases With Scale
As systems grow:
• number of services increases
• number of metrics explodes
• log volume becomes massive
• traces become complex
This leads to:
High observability coverage → Low observability clarity
The more signals you have, the harder it becomes to interpret them without correlation.
Real Incident Example
Symptom:
• increased API latency
Signals:
• metrics → latency spike
• logs → timeout errors
• events → deployment updated
• traces → retries increased
Without correlation:
Engineer spends 20–40 minutes connecting these manually.
With correlation:
You immediately see:
“Latency increased after deployment v2.5. Retry rate increased. Downstream service latency degraded.”
That’s the difference between data and insight.
Why Traditional Observability Fails
Traditional setups focus on:
• collecting signals
• visualizing data
• alerting thresholds
But they lack:
• relationship mapping
• change-to-impact linkage
• cross-signal context
• dependency awareness
This results in:
❌ dashboards without answers
❌ alerts without explanations
❌ logs without context
What True Observability Requires
True observability is not about tools.
It’s about connecting signals into a narrative.
It requires:
🔗 Cross-Signal Correlation
Link logs, metrics, traces, and events
⏱️ Timeline Awareness
Understand what changed before the issue
🧠 Dependency Context
Map service-to-service interactions
🔍 Root Cause Focus
Identify origin, not just symptoms
How KubeHA Helps
KubeHA transforms observability from fragmented data into actionable insights.
🔗 Automatic Correlation
KubeHA connects:
• logs
• metrics
• Kubernetes events
• deployment changes
• pod restarts
into a single investigation flow.
⏱️ Change-to-Impact Analysis
Example insight:
“Error rate increased after deployment v3.2. Pod restarts observed. Downstream latency increased.”
🧠 Root Cause Identification
Instead of:
❌ “High latency detected”
You get:
✅ “Latency caused by dependency slowdown triggered after config change.”
⚡ Faster MTTR
KubeHA eliminates manual correlation, helping teams:
• reduce debugging time
• avoid false assumptions
• act on accurate insights
Real Outcome for Teams
Teams that adopt correlation-driven observability achieve:
• faster incident resolution
• fewer escalations
• improved system reliability
• reduced cognitive load during incidents
Final Thought
Observability is not about how much data you collect.
It’s about how well you connect the data you already have.
Without correlation, observability is just noise.
With correlation, it becomes understanding.
👉 To learn more about observability correlation, Kubernetes debugging, and production incident analysis, follow KubeHA (https://linkedin.com/showcase/kubeha-ara/).
Book a demo today at https://kubeha.com/schedule-a-meet/
Experience KubeHA today: www.KubeHA.com
KubeHA’s introduction, https://www.youtube.com/watch?v=PyzTQPLGaD0
#DevOps #sre #monitoring #observability #remediation #Automation #kubeha #IncidentResponse #AlertRecovery #prometheus #opentelemetry #grafana, #loki #tempo #trivy #slack #Efficiency #ITOps #SaaS #ContinuousImprovement #Kubernetes #TechInnovation #StreamlineOperations #ReducedDowntime #Reliability #ScriptingFreedom #MultiPlatform #SystemAvailability #srexperts23 #sredevops #DevOpsAutomation #EfficientOps #OptimizePerformance #Logs #Metrics #Traces #ZeroCode