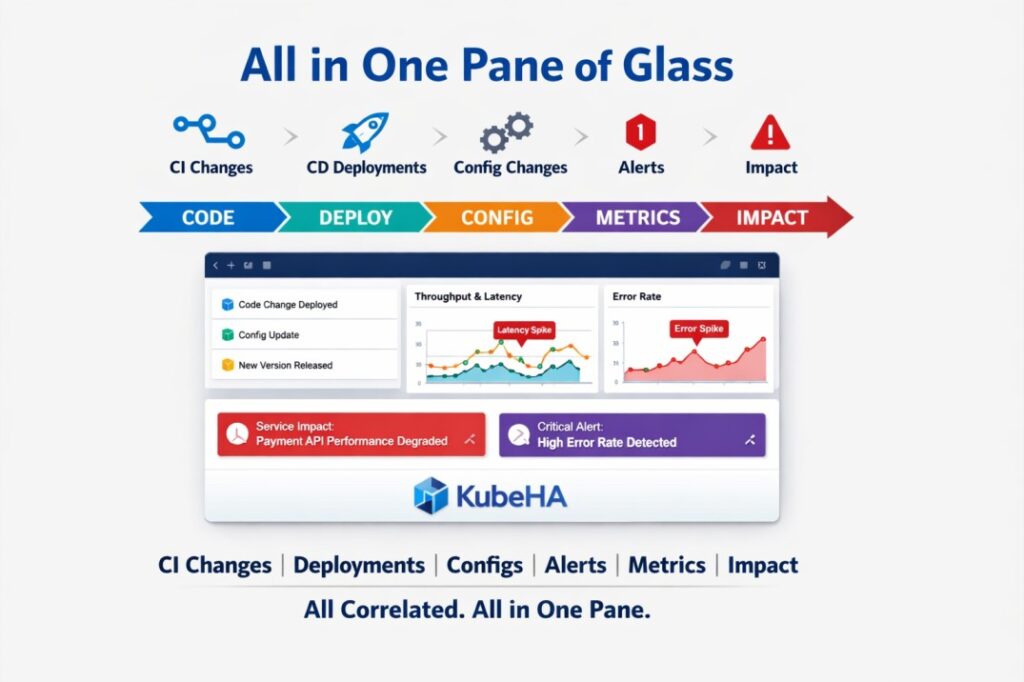
From CI to Impact – All in One Pane.
How many tabs do you open to understand one production issue?
• CI Changes
• CD Deployments
• Config Modifications
• Alerts
• Impacted Services
• Throughput Drops
• Error Rate Spikes
• Latency Changes
Now imagine seeing all of this in a single pane of glass. KubeHA connects the dots between code → deploy → config → metrics → alerts → impact
So your SREs don’t investigate blindly — they investigate with context.
No more guessing.
No more dashboard hopping.
Just clear correlation. Clear answers. Observability is good. Correlated intelligence is better.
Follow KubeHA(https://lnkd.in/gGmRDs77) to learn more.
Book a demo today athttps://lnkd.in/dytfT3kk
Experience KubeHA today:www.KubeHA.com
KubeHA’s introduction,https://lnkd.in/gjK5QD3i
#DevOps #sre #monitoring #observability #remediation #Automation #kubeha #IncidentResponse #AlertRecovery #prometheus #opentelemetry #grafana, #loki #tempo #trivy #slack #Efficiency #ITOps #SaaS #ContinuousImprovement #Kubernetes #TechInnovation #StreamlineOperations #ReducedDowntime #Reliability #ScriptingFreedom #MultiPlatform #SystemAvailability #srexperts23 #sredevops #DevOpsAutomation #EfficientOps #OptimizePerformance #Logs #Metrics #Traces #ZeroCode