For nearly a decade, the primary workflow for incident investigation looked like this:
Alert
 ↓
Dashboard
 ↓
Metrics
 ↓
Logs
 ↓
Guess Root Cause
SREs became experts at navigating dashboards.
Prometheus.
Grafana.
Datadog.
New Relic.
CloudWatch.
Thousands of charts.
Hundreds of alerts.
Dozens of dashboards.
Yet something interesting happened:
More dashboards did not necessarily lead to faster incident resolution.
In many organizations, Mean Time To Resolution (MTTR) remained stubbornly high.
The reason is simple:
Dashboards show what happened.
They rarely explain why it happened.
The Dashboard Problem
Imagine an incident:
10:15 AM
Latency increases
Dashboard shows:
• CPU normal
• Memory normal
• Request rate normal
• Error rate increasing
Useful?
Yes.
Sufficient?
No.
Because the real questions are:
• What changed before 10:15?
• Was a deployment rolled out?
• Did a ConfigMap change?
• Did an HPA event occur?
• Did a dependency become slow?
• Did Kubernetes reschedule Pods?
Most dashboards don’t answer these questions.
They force engineers to manually piece together the story.
Real Incidents Are Event Chains
Production outages rarely originate from a single metric spike.
They typically look like this:
10:02 Deployment Started
 ↓
10:04 Config Updated
 ↓
10:06 Pod Restarted
 ↓
10:08 Dependency Latency Increased
 ↓
10:11 Retry Traffic Increased
 ↓
10:15 User Errors Increased
The problem isn’t the final error.
The problem is the sequence.
A dashboard shows:
Error Rate ↑ A timeline shows:
Why Error Rate ↑ That is a fundamental difference.
Why Modern Systems Need Timelines
Today’s Kubernetes environments contain:
• Microservices
• Service Meshes
• OpenTelemetry
• Autoscalers
• Operators
• Admission Controllers
• GitOps Controllers
• AI Workloads
Every minute dozens of events occur.
Examples:
Deployment changes
Pod restarts
Node pressure
Scaling events
Config changes
Secret rotations
DNS issues
Control plane delays
The challenge is no longer collecting data.
The challenge is reconstructing causality.
Observability Is Moving Toward Time-Based Correlation
Historically:
Metrics-Centric Observability Current trend:
Timeline-Centric Observability Engineers increasingly need answers such as:
Show me everything that happened 15 minutes before this alert.
Not:
Show me another dashboard.
This shift is already happening across:
• OpenTelemetry ecosystems
• AI observability platforms
• Incident response tools
• Modern SRE workflows
Why OpenTelemetry Accelerates This Trend
OpenTelemetry introduced a common language for:
• Metrics
• Logs
• Traces
But traces introduced something even more important:
Temporal context Every span exists within a timeline.
Every request has a story.
Every incident has a sequence.
This naturally pushes observability toward timeline-based investigation.
Why Dashboards Create Cognitive Load
During incidents, engineers often jump between:
Grafana
 ↓
Loki
 ↓
Tempo
 ↓
kubectl events
 ↓
GitOps logs
 ↓
Back to Grafana
This creates:
• Context switching
• Information overload
• Slower debugging
The more tools involved, the harder it becomes to connect events mentally.
The Rise of Timeline-Based Debugging
Future investigations will increasingly look like:
Alert
 ↓
Timeline
 ↓
Correlated Events
 ↓
Root Cause
 ↓
Resolution
Instead of:
Alert
 ↓
Dashboard 1
 ↓
Dashboard 2
 ↓
Dashboard 3
 ↓
Logs
 ↓
Guess
Timelines naturally expose causality.
Humans understand stories better than graphs.
How KubeHA Helps
This shift toward timeline-driven operations aligns directly with KubeHA’s vision.
KubeHA correlates:
• Kubernetes events
• Deployments
• Config changes
• HPA activity
• Pod restarts
• Logs
• Metrics
• Traces
• Control plane signals
into a unified operational timeline.
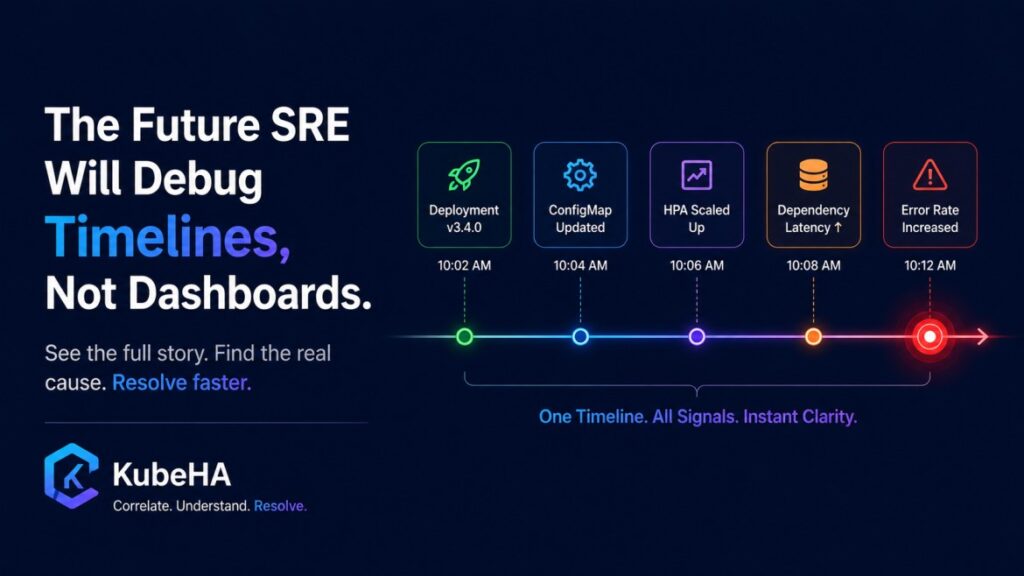
Example Investigation
Without KubeHA:
Latency Alert
 ↓
Open Grafana
 ↓
Open Loki
 ↓
Open Tempo
 ↓
Check Deployments
 ↓
Check Events
 ↓
Correlate manually
With KubeHA:
10:02 Deployment v3.4
 ↓
10:04 Config Updated
 ↓
10:06 HPA Triggered
 ↓
10:08 Dependency Latency Increased
 ↓
10:12 Error Rate Increased
Root cause becomes immediately visible.
Why This Matters for SREs
The future challenge isn’t:
How many dashboards do you have?
The future challenge is:
How quickly can you reconstruct the sequence of events that caused the incident?
The teams that answer that question fastest will have:
• Lower MTTR
• Better reliability
• Less alert fatigue
• More efficient operations
Final Thought
Dashboards are not disappearing.
They remain valuable for monitoring trends and system health.
But incident response is evolving.
The most effective SREs of the next decade won’t be dashboard experts.
They’ll be timeline investigators.
Because modern outages are not isolated failures.
They’re stories.
And stories are best understood through timelines.
👉 To learn more about timeline-driven observability, Kubernetes incident correlation, OpenTelemetry, and next-generation SRE practices, follow KubeHA (https://linkedin.com/showcase/kubeha-ara/).
Book a demo today at https://kubeha.com/schedule-a-meet/
Experience KubeHA today: www.KubeHA.com
KubeHA’s introduction, https://www.youtube.com/watch?v=PyzTQPLGaD0
#DevOps #sre #monitoring #observability #remediation #Automation #kubeha #IncidentResponse #AlertRecovery #prometheus #opentelemetry #grafana, #loki #tempo #trivy #slack #Efficiency #ITOps #SaaS #ContinuousImprovement #Kubernetes #TechInnovation #StreamlineOperations #ReducedDowntime #Reliability #ScriptingFreedom #MultiPlatform #SystemAvailability #srexperts23 #sredevops #DevOpsAutomation #EfficientOps #OptimizePerformance #Logs #Metrics #Traces #ZeroCode.