
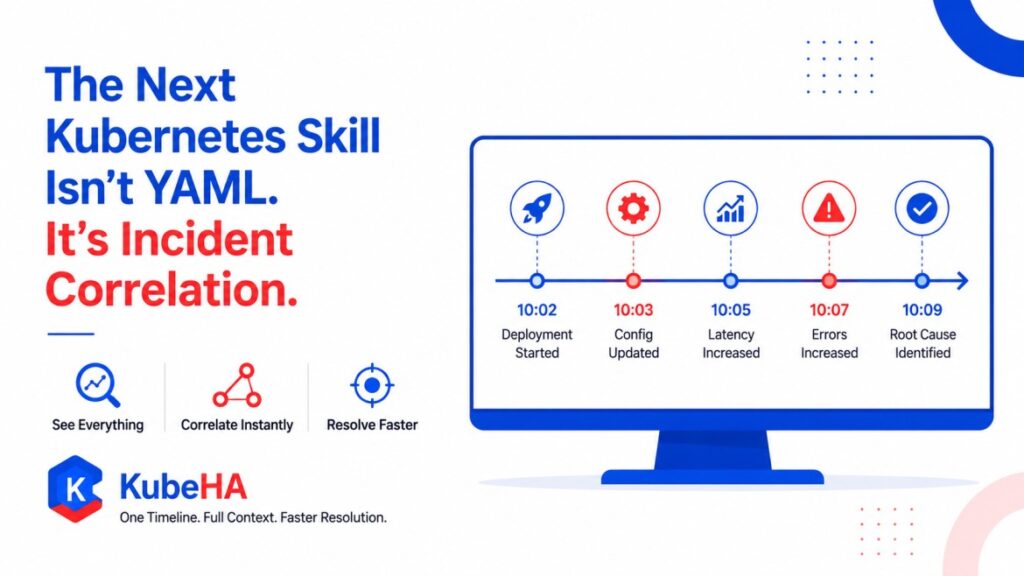
The Next Kubernetes Skill Isn’t YAML. It’s Incident Correlation.
For years, Kubernetes expertise was measured by one thing:
How well you understood YAML.
Could you write a Deployment from memory?
Did you know the difference between:
StatefulSet
DaemonSet
ReplicaSet
Job
CronJob
Could you troubleshoot:
Affinity
Taints
Tolerations
NetworkPolicies
RBAC
These skills built the first generation of Kubernetes engineers.
But Kubernetes has changed.
Clusters have become larger.
Applications have become distributed.
Infrastructure has become dynamic.
And incidents have become significantly more complex.
Today, the engineer who writes the best YAML isn’t necessarily the engineer who resolves incidents the fastest.
The next critical Kubernetes skill isn’t YAML.
It’s incident correlation.
Kubernetes Is No Longer Just About Deployments
Ten years ago, a Kubernetes application looked something like this:
Ingress
   ↓
Deployment
   ↓
Service
   ↓
Database
Simple.
Today, a production workload often includes:
Service Mesh
OpenTelemetry
HPA
VPA
GitOps
Admission Controllers
Sidecars
eBPF
External Secrets
CSI Drivers
CNI Plugins
AI inference services
Multi-cluster routing
Every deployment touches dozens of components.
Every incident crosses multiple layers.
YAML Doesn’t Explain Incidents
Imagine your application suddenly experiences:
Latency ↑
Your Deployment YAML looks perfect.
Your Service YAML hasn’t changed.
Your Ingress is valid.
Yet users are experiencing failures.
Why?
Because production incidents rarely originate from YAML syntax.
They originate from interactions between systems.
A Real Production Incident
Let’s walk through a common example.
10:02 Deployment Started
 ↓
10:03 ConfigMap Updated
 ↓
10:04 OpenTelemetry Collector CPU Increased
 ↓
10:05 DNS Latency Increased
 ↓
10:06 Payment Service Retries Increased
 ↓
10:07 Database Connections Saturated
 ↓
10:08 HPA Triggered
 ↓
10:10 User Errors Increased
Which YAML caused the outage?
None.
The problem wasn’t configuration syntax.
The problem was understanding how one event triggered the next.
Kubernetes Is Becoming an Event-Driven Platform
Every minute, your cluster generates thousands of signals.
Examples:
Infrastructure
Node pressure
Disk pressure
Memory pressure
Kubernetes
Pod scheduling
Evictions
Restarts
HPA
Deployment rollouts
Applications
Errors
Latency
Retries
Timeouts
Networking
DNS failures
TCP retransmissions
Packet drops
Observability
Logs
Metrics
Traces
Every one of these tells part of the story.
None tells the whole story.
The Biggest Skill Gap Today
Most engineers know how to answer:
What happened?
Very few can quickly answer:
Why did it happen?
That difference defines modern SRE maturity.
Because modern debugging isn’t about finding data.
It’s about connecting data.
The Evolution of Kubernetes Skills
Generation 1
Infrastructure Engineers
Skills:
Linux
Networking
Storage
Generation 2
Kubernetes Engineers
Skills:
YAML
Helm
kubectl
RBAC
Generation 3
Platform Engineers
Skills:
GitOps
Observability
CI/CD
Multi-cluster
Generation 4
Incident Engineers
Skills:
Correlation
Timelines
Root Cause Analysis
System Thinking
AI-assisted Investigation
This is where the industry is heading.
Why Dashboards Aren’t Enough
During an outage, engineers often open:
Grafana
Prometheus
Loki
Tempo
ArgoCD
Kubernetes Events
Git History
Cloud Logs
Every tool answers a different question.
The engineer becomes responsible for assembling the complete picture.
This process is slow.
It increases MTTR.
It increases alert fatigue.
It increases cognitive load.
Correlation Is the New Superpower
Imagine two engineers.
Engineer A
Knows every Kubernetes object.
Can write perfect YAML.
Knows Helm inside out.
Still spends 45 minutes finding the root cause.
Engineer B
Understands:
deployments
dependencies
traces
events
timelines
networking
system behavior
Finds the root cause in 8 minutes.
Who is more valuable during a production incident?
The answer is obvious.
AI Will Reward Correlation Skills
AI is changing operations rapidly.
Soon, AI will generate:
dashboards
YAML
manifests
Helm charts
PromQL
Terraform
These tasks are becoming increasingly automated.
But AI still depends on context.
Someone must understand:
why events are connected
why latency propagated
why retries increased
why scaling happened
why customers were impacted
Incident correlation becomes the skill that amplifies AI rather than competes with it.
Why OpenTelemetry and eBPF Accelerate This Shift
OpenTelemetry provides:
Metrics
Logs
Traces
eBPF provides:
Kernel visibility
Network behavior
System calls
Kubernetes provides:
Events
Scheduling
Resource changes
GitOps provides:
Deployment history
Prometheus provides:
Metrics
Loki provides:
Logs
Tempo provides:
Traces
The challenge isn’t collecting more data.
The challenge is understanding relationships across these data sources.
How KubeHA Helps
This is exactly the problem KubeHA is designed to solve.
Instead of asking engineers to manually jump between multiple tools, KubeHA automatically correlates:
Kubernetes events
Deployment history
ConfigMap and Secret changes
Prometheus metrics
Loki logs
OpenTelemetry/Tempo traces
eBPF networking events
Control plane telemetry
Pod lifecycle events
Autoscaler activity
into a single investigation timeline.
Example
Without KubeHA:
Prometheus
 ↓
Grafana
 ↓
Loki
 ↓
Tempo
 ↓
kubectl
 ↓
GitOps
 ↓
Cloud Logs
 ↓
Root Cause
Engineer spends most of the time collecting evidence.
With KubeHA:
10:02 Deployment Started
 ↓
10:03 Config Updated
 ↓
10:04 DNS Latency Increased
 ↓
10:05 TCP Retransmissions Increased
 ↓
10:06 Retry Storm Began
 ↓
10:07 Database Saturated
 ↓
10:09 Error Rate Increased
 ↓
Root Cause Identified
Instead of navigating tools, engineers investigate a unified operational story.
This dramatically reduces MTTR and helps teams focus on solving problems rather than assembling data.
What the Next Great Kubernetes Engineer Looks Like
Five years ago:
The best engineer could write complex Kubernetes manifests from memory.
Five years from now:
The best engineer will understand:
distributed systems
dependency graphs
telemetry correlation
change intelligence
incident timelines
AI-assisted investigations
Because Kubernetes itself is becoming increasingly autonomous.
The human value shifts from deployment to diagnosis.
Final Thought
YAML isn’t going away.
It’s still a foundational Kubernetes skill.
But it is no longer enough.
The complexity of modern cloud-native systems demands engineers who can think beyond individual resources and understand entire systems.
The future belongs to engineers who can answer not just:
“What happened?”
But more importantly:
“Why did it happen, how did it propagate, and what should we fix first?”
That is incident correlation.
And it may become the most valuable Kubernetes skill of the next decade.
 To learn more about Kubernetes incident correlation, OpenTelemetry, eBPF, timeline-driven debugging, and AI-powered SRE workflows, follow KubeHA(https://linkedin.com/showcase/kubeha-ara/).
Book a demo today at https://kubeha.com/schedule-a-meet/
Experience KubeHA today: www.KubeHA.com
KubeHA’s introduction, https://www.youtube.com/watch?v=PyzTQPLGaD0
#DevOps #sre #monitoring #observability #remediation #Automation #kubeha #IncidentResponse #AlertRecovery #prometheus #opentelemetry #grafana, #loki #tempo #trivy #slack #Efficiency #ITOps #SaaS #ContinuousImprovement #Kubernetes #TechInnovation #StreamlineOperations #ReducedDowntime #Reliability #ScriptingFreedom #MultiPlatform #SystemAvailability #srexperts23 #sredevops #DevOpsAutomation #EfficientOps #OptimizePerformance #Logs #Metrics #Traces #ZeroCode..