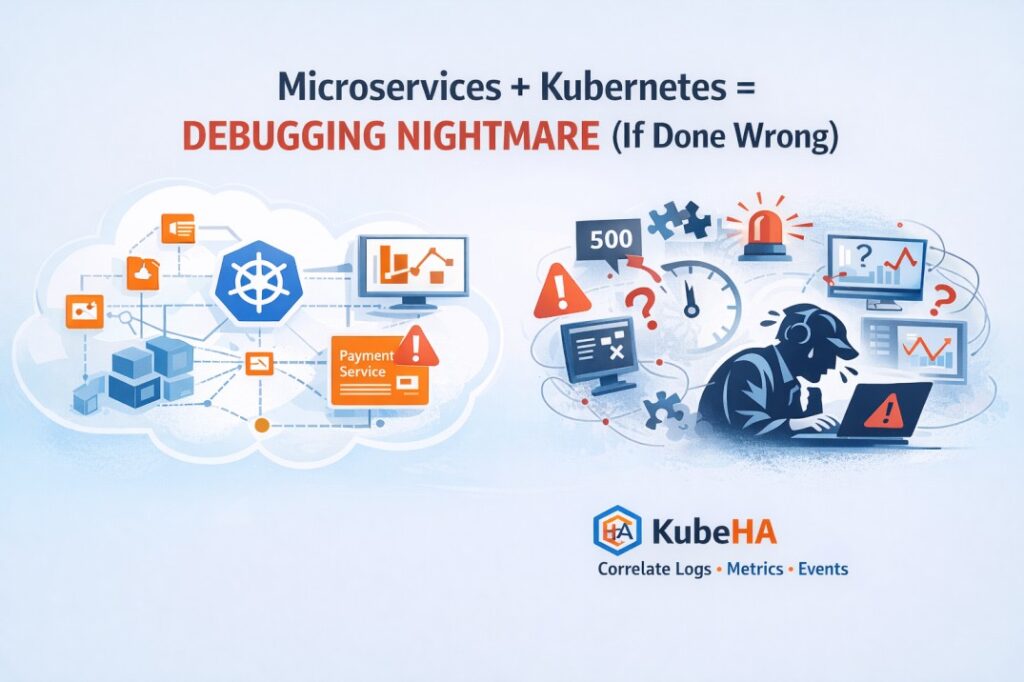
Microservices + Kubernetes = Debugging Nightmare (If Done Wrong)
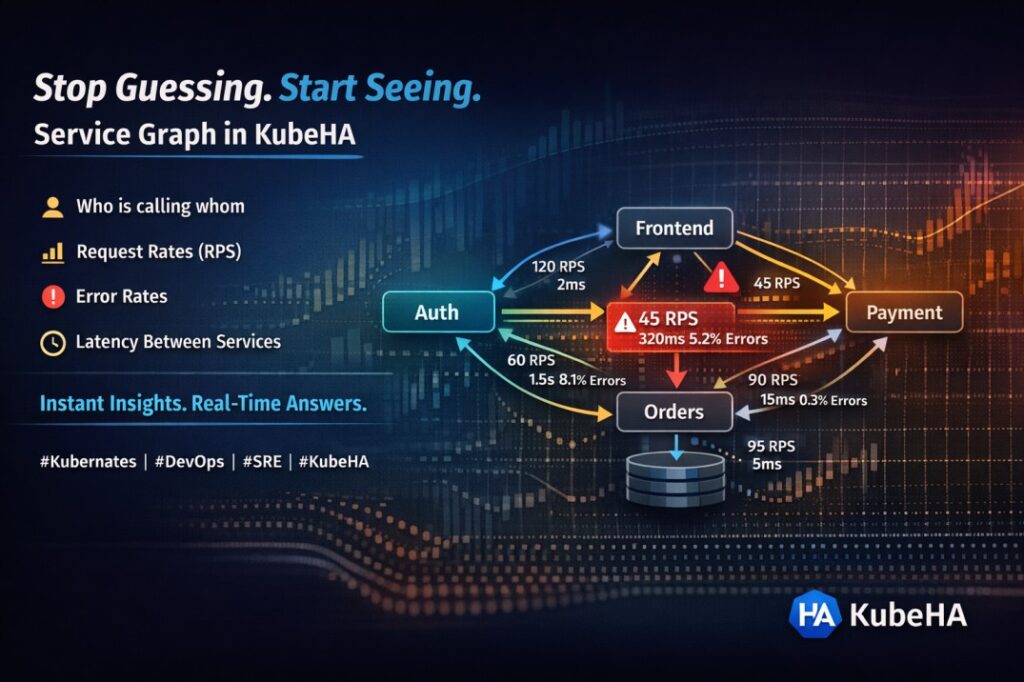
Microservices promised scalability, flexibility, and independent deployments. Kubernetes made it possible to run them at scale. But together, they introduced a new problem: Debugging distributed systems is exponentially harder than building them. Why Debugging Becomes a Nightmare In a monolith: • one codebase• one runtime• one log stream• one failure domain In microservices on Kubernetes: […]
Microservices + Kubernetes = Debugging Nightmare (If Done Wrong) Read More »