 Kubernetes Debugging: Then vs Now vs Intelligent
Debugging Kubernetes issues has evolved.
But has it evolved enough?
Let’s compare 

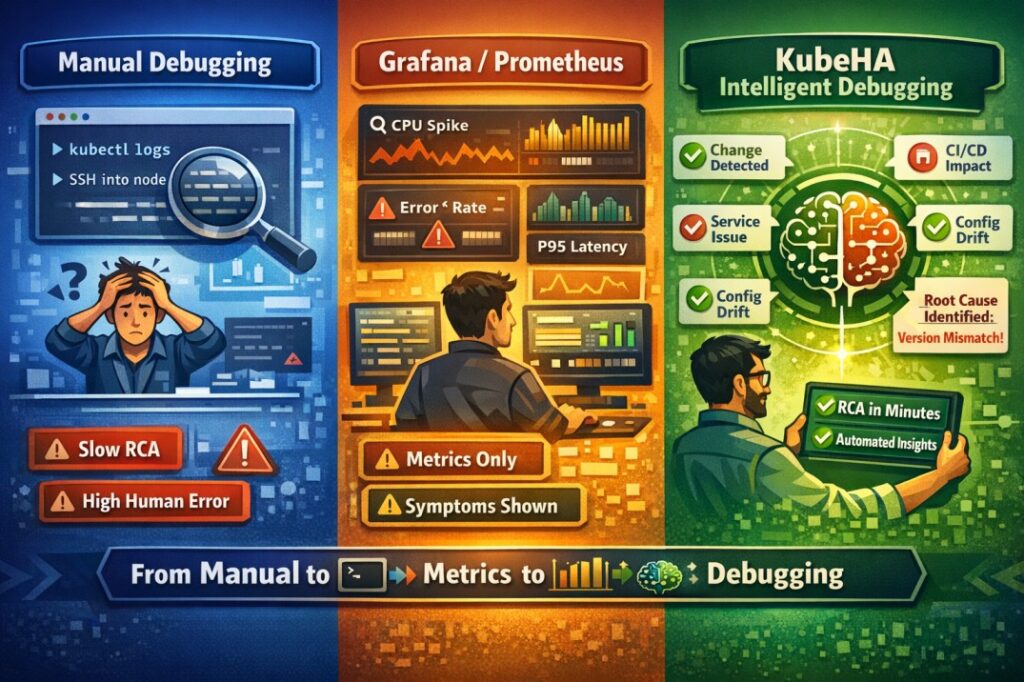
 Manual (Traditional) Debugging
• kubectl describe pod
• kubectl logs -f
• Check events
• SSH into nodes
• Grep logs
• Reproduce issue Time to RCA: 30 mins – hours
 Risk: Human error, tunnel vision
 Depends heavily on individual expertise
 No correlation between logs, metrics, changes
You react after downtime.
 Debugging with Grafana / Prometheus
• See CPU spike
• Check error rate increase
• Inspect dashboards
• View latency P95/P99
• Look at Alert firing Faster visibility
 Metrics clarity
 But…
But…
You still manually correlate:
What changed?
Which deployment triggered this?
Which service is impacted?
Is this related to CI/CD?
Config drift?
Observability shows symptoms – not root cause.
 Debugging with KubeHA
KubeHA combines: Cluster Changes (who changed what & when)
CI/CD Activity
Service Impact
Error Rate / Latency / Throughput
Config & Security drift
Alerts correlation
AI-based RCA
Instead of:
“CPU is high…”
You see:
Deployment X updated image at 10:02
Error rate increased at 10:04
Service Y impacted
Config drift detected
Likely root cause: Version mismatch RCA in minutes – not hours
Cross-layer correlation
Change-driven debugging
Context-aware analysis The Shift
Traditional Debugging = Command Level
Grafana Debugging = Metric Level
KubeHA Debugging = Intelligence Level
Modern SREs don’t just want dashboards.
They want answers.
Are you still debugging… or are you correlating intelligently?
Follow KubeHA(https://lnkd.in/gGmRDs77) to learn more.
Book a demo today athttps://lnkd.in/dytfT3kk
Experience KubeHA today:www.KubeHA.com
KubeHA’s introduction,https://lnkd.in/gjK5QD3i
#DevOps #sre #monitoring #observability #remediation #Automation #kubeha #IncidentResponse #AlertRecovery #prometheus #opentelemetry #grafana, #loki #tempo #trivy #slack #Efficiency #ITOps #SaaS #ContinuousImprovement #Kubernetes #TechInnovation #StreamlineOperations #ReducedDowntime #Reliability #ScriptingFreedom #MultiPlatform #SystemAvailability #srexperts23 #sredevops #DevOpsAutomation #EfficientOps #OptimizePerformance #Logs #Metrics #Traces #ZeroCode