For years, Kubernetes observability focused almost entirely on:
- Applications
- Services
- Pods
- Databases
Meanwhile, the Kubernetes control plane remained a black box.
When something went wrong, SREs often relied on:
kubectl describe
kubectl get events
kube-apiserver logs
etcd logs
And a lot of educated guessing.
That is finally starting to change.
Recent Kubernetes releases have significantly improved control plane tracing capabilities, making it possible to observe how requests move through the Kubernetes control plane itself.
For SREs, this is a major shift.
Why the Kubernetes Control Plane Was Hard to Debug
When a user runs:
kubectl apply -f deployment.yaml A surprising amount happens behind the scenes:
kubectl
   ↓
API Server
   ↓
Authentication
   ↓
Authorization
   ↓
Admission Controllers
   ↓
etcd
   ↓
Watch Streams
   ↓
Controllers
   ↓
Scheduler
   ↓
Kubelet
If deployment latency suddenly increases, where is the bottleneck?
Traditionally, answering this required:
- log analysis
- metric correlation
- manual timing comparisons
There was no easy way to see the entire request journey.
What Control Plane Tracing Changes
Control plane tracing introduces distributed tracing concepts directly into Kubernetes internals.
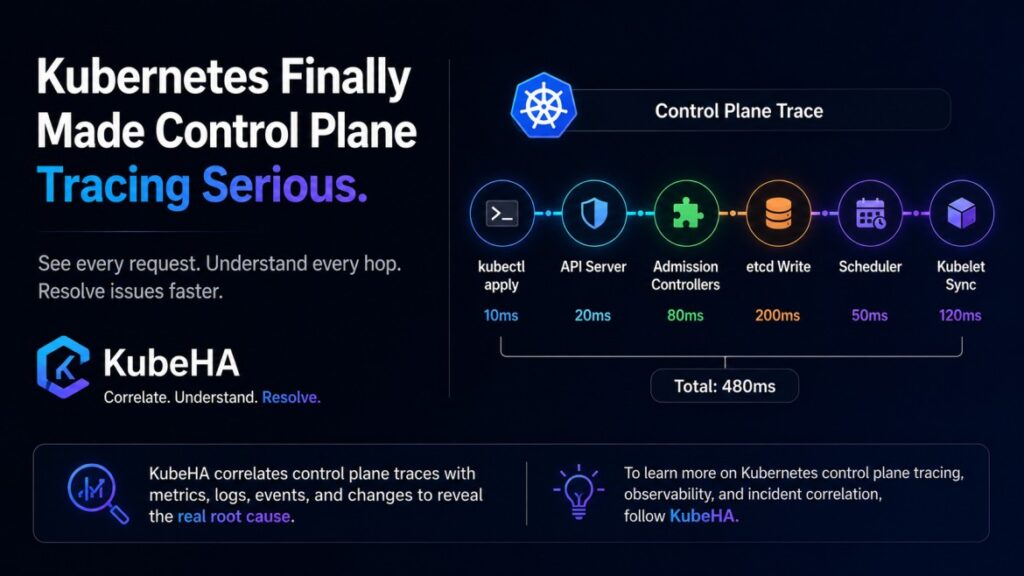
Now a single request can be represented as a trace:
kubectl apply
   ↓
API Server (20ms)
   ↓
Admission Controller (80ms)
   ↓
etcd Write (200ms)
   ↓
Scheduler (50ms)
   ↓
Kubelet Sync (120ms)
Instead of:
Deployment took 500ms You can understand:
Deployment took 500ms
because etcd consumed 200ms
and admission webhooks consumed 80ms
That is a completely different level of visibility.
Why This Matters for Production Clusters
Many large-scale Kubernetes issues originate inside the control plane.
Examples include:
API Server Saturation
Symptoms:
- slow kubectl commands
- delayed deployments
- watch timeouts
Root cause often hidden in request processing.
Admission Webhook Latency
Common in clusters using:
- Kyverno
- Gatekeeper
- security scanners
- custom admission controllers
A slow webhook can add hundreds of milliseconds to every API operation.
Scheduler Delays
Symptoms:
Pods Pending But why?
Tracing reveals:
- scheduling queue delays
- plugin execution bottlenecks
- node filtering overhead
etcd Performance Issues
Symptoms:
- slow resource creation
- delayed updates
- control plane instability
Tracing helps isolate whether latency originates from etcd itself.
The Next Evolution of Kubernetes Observability
Historically:
Metrics → Show symptoms Examples:
- API latency increased
- Scheduler latency increased
- etcd latency increased
Useful.
But not enough.
Tracing introduces:
Request-level causality Instead of knowing:
Something is slow
You learn:
Exactly what made it slow
Why Most Teams Still Won’t Use It Properly
This is where the challenge begins.
Many organizations are already overwhelmed by:
- metrics
- logs
- traces
- events
Adding control plane traces introduces even more data.
Without correlation, teams may simply create:
More visibility
More complexity
Instead of:
More understanding How KubeHA Helps
Control plane tracing is incredibly powerful.
But tracing alone doesn’t provide root cause analysis.
KubeHA helps correlate:
- API server traces
- Scheduler behavior
- etcd latency
- Kubernetes events
- deployment changes
- HPA activity
- application metrics
- logs
into a single operational timeline.
Example Investigation
Without KubeHA:
API Server Latency ↑
Scheduler Latency ↑
Deployment Failed
etcd Write Latency ↑
Engineer manually correlates everything.
With KubeHA:
Deployment v4.2 introduced
↓
Admission webhook latency increased
↓
API server request duration increased
↓
Scheduler queue backed up
↓
Pod startup delayed
The entire chain becomes visible.
Why This Is Important for SREs
Control plane tracing shifts Kubernetes debugging from:
"What is slow?" to
"Why is it slow?" That is the difference between:
• monitoring and
• understanding
As clusters become larger and more complex, this distinction becomes critical.
The Bigger Trend
Over the next few years, Kubernetes observability will likely evolve from:
Metrics-Centric to
Trace-Centric Not just for applications.
But for Kubernetes itself.
The control plane is becoming observable in ways that were impossible a few years ago.
The teams that learn how to leverage this visibility will diagnose issues faster, reduce MTTR, and operate clusters more efficiently.
Final Thought
Control plane tracing may be one of the most underrated Kubernetes improvements in recent years.
Most engineers are still focused on tracing applications.
Soon, they’ll realize that tracing Kubernetes itself can be just as valuable.
Because sometimes the problem isn’t inside your application.
Sometimes the problem is inside the platform running it.
👉 To learn more about Kubernetes control plane observability, distributed tracing, and production incident correlation, follow KubeHA (https://linkedin.com/showcase/kubeha-ara/).
Book a demo today at https://kubeha.com/schedule-a-meet/
Experience KubeHA today: www.KubeHA.com
KubeHA’s introduction, https://www.youtube.com/watch?v=PyzTQPLGaD0
#DevOps #sre #monitoring #observability #remediation #Automation #kubeha #IncidentResponse #AlertRecovery #prometheus #opentelemetry #grafana, #loki #tempo #trivy #slack #Efficiency #ITOps #SaaS #ContinuousImprovement #Kubernetes #TechInnovation #StreamlineOperations #ReducedDowntime #Reliability #ScriptingFreedom #MultiPlatform #SystemAvailability #srexperts23 #sredevops #DevOpsAutomation #EfficientOps #OptimizePerformance #Logs #Metrics #Traces #ZeroCode