
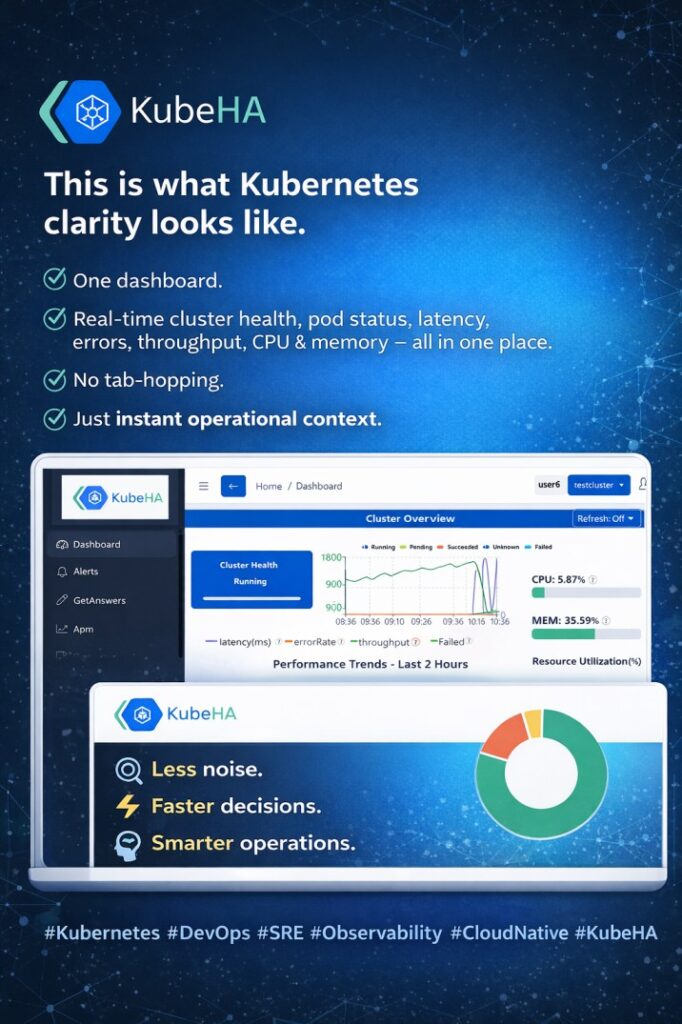
This snapshot is from KubeHA’s Cluster Overview 
(Yes — this is a real working dashboard)
 In one view, you can instantly see:
Cluster health status (at-a-glance)
Latency, error rate & throughput trends
Pod health by status (Running / Pending / Failed / Unknown)
CPU & memory utilization — clearly, without noise
 The goal isn’t just observability.
It’s context-aware visibility.
Instead of jumping between:
Prometheus → Events → kubectl → Logs → Traces
KubeHA brings them together into a single operational picture.
For SREs & DevOps teams, this means: Faster incident understanding Clear correlation across metrics, pods & resources Less time guessing, more time fixing
This is how we’re rethinking Kubernetes observability & operations — simple, correlated, and actionable.
 Curious to see where this goes next?
Phase-2 (APM & Traces) and Phase-3 (Anomaly & Security) build on top of this foundation.
Follow KubeHA (https://lnkd.in/gV4Q2d4m)
Experience KubeHA today: www.KubeHA.com
KubeHA’s introduction: https://lnkd.in/gjK5QD3i
#DevOps #sre #monitoring #observability #remediation #Automation #kubeha #IncidentResponse #AlertRecovery #prometheus #opentelemetry #grafana, #loki #tempo #trivy #slack #Efficiency #ITOps #SaaS #ContinuousImprovement #Kubernetes #TechInnovation #StreamlineOperations #ReducedDowntime #Reliability #ScriptingFreedom #MultiPlatform #SystemAvailability #srexperts23 #sredevops #DevOpsAutomation #EfficientOps #OptimizePerformance #Logs #Metrics #Traces #ZeroCode